Day 2
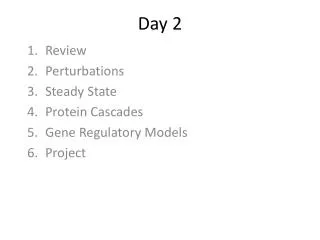
Day 2. Review Perturbations Steady State Protein Cascades Gene Regulatory Models Project. Day 2. Template Script available at the web site. Applying Perturbations in Tellurium. m1. m. import tellurium as te import numpy r = te.loada (``` # Model Definition

Day 2
E N D
Presentation Transcript
Day 2 Review Perturbations Steady State Protein Cascades Gene Regulatory Models Project
Day 2 Template Script available at the web site.
Applying Perturbations in Tellurium m1 m import tellurium as te import numpy r = te.loada (``` # Model Definition v1: $Xo -> S1; k1*Xo; v2: S1 -> $w; k2*S1; # Initialize constants k1 = 1; k2 = 1; S1 = 15; Xo = 1; ```) # Time course simulation m1 = r.simulate (0, 15, 100, [“Time”,”S1”]); r.model.k1 = r.model.k1 * 6; m2 = r.simulate (15, 40, 100, [“Time”,”S1”]); r.model.k1 = r.model.k1 / 6; m3 = r.simulate (40, 60, 100, [“Time”>,”S1”]); m = numpy.vstack ((m1, m2, m3)); # Merge data r.plot (m) m2 vstack ((m1, m2)) -> m (augment by row)
Perturbations to Variables import tellurium as te import numpy r = te.loada (''' $Xo -> S1; k1*Xo; S1 -> $X1; k2*S1; k1 = 0.2; k2 = 0.4; Xo = 1; S1 = 0.5; ''') # Simulate the first part up to 20 time units m1 = r.simulate (0, 20, 100, ["time", "S1"]); # Perturb the concentration of S1 by 0.35 units r.model.S1 = r.model.S1 + 0.35; # Continue simulating from last end point m2 = r.simulate (20, 50, 100, ["time", "S1"]); # Merge and plot the two halves of the simulation r.plot (numpy.vstack ((m1, m2)));
More on Plotting import tellurium as te import numpy import matplotlib.pyplot as plt r = te.loada (''' $Xo -> S1; k1*Xo; S1 -> $X1; k2*S1; k1 = 0.2; k2 = 0.4; Xo = 1; S1 = 0.5; ''') # Simulate the first part up to 20 time units m1 = r.simulate (0, 20, 100, ["time", "S1"]); r.model.S1 = r.model.S1 + 0.35; m2 = r.simulate (20, 50, 100, ["time", "S1"]); plt.ylim ((0,1)) plt.xlabel ('Time') plt.ylabel ('Concentration') plt.title ('My First Plot ($y = x^2$)') r.plot (numpy.vstack ((m1, m2)));
Three Important Plot Commands r.plot (result) # Plots a legend te.plotArray (result) # No legend te.setHold (True) # Overlay plots
Example of Hold import tellurium as te import numpy import matplotlib.pyplot as plt # model Definition r = te.loada (''' v1: $Xo -> S1; k1*Xo; v2: S1 -> $w; k2*S1; //initialize. Deterministic process. k1 = 1; k2 = 1; S1 = 20; Xo = 1; ''') m1 = r.simulate (0,20,100); # Stochastic process. r.resetToOrigin() m2 = r.gillespie (0, 20, 100, ['time', 'S1']) # plot all the results together te.setHold (True) te.plotArray (m1) te.plotArray (m2)
Open System, Steady State • r.steadystate(); • This method returns a single number. • This number indicates how close the solution is to the steady state. • Numbers < 1E-5 usually indicate it has found a steady state. • Confirm using print r.dv() <- prints rates of change
Useful Model Variables • r.dv() <- returns the rates of change vector dx/dt • r.sv() <- returns vector of current floating species • concentrations • r.fs() <- returns list of floating species • names (same order as sv)
Useful Model Variables • r.pv() <- returns vector of all current parameter values • r.ps() <- returns list of kinetic parameter names • r.bs() <- returns list of boundary species names
Activator Cascades Output
Build a model of a protein cycle 2 Use simple irreversible mass-action kinetics for the forward and reverse arms. 3. Investigate how the steady state concentration of the phosphorylated protein changes as a function of the forward rate constant. Properties of Protein Cycles
1. Investigate what happens when you use simple irreversible Michaelis-Menten Kinetics. 2. Investigate how the response changes as you decrease the two Kms Properties of Protein Cycles
Multiple Protein Cycles forming a Cascade Activator Cascade two cycles together
Gene Regulation Refer to writing board
Project Degradation E2 Activator E1 S E3 Metabolism Gene Regulation Protein Regulation
Project: 1 Activator
Project: 2 Degradation E2 Activator E3
Project: 3 Degradation E2 Activator E1 S E3