
Uploaded by
alicia
2 SLIDES
242 VUES
20LIKES
NA-IMRT
DESCRIPTION
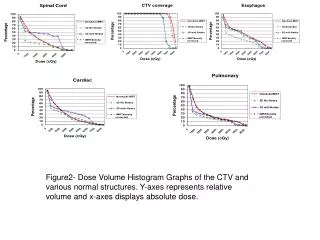
Figure2- Dose Volume Histogram Graphs of the CTV and various normal structures. Y-axes represents relative volume and x-axes displays absolute dose. NA-IMRT. A-IMRT. CNO. CPNI. NA-IMRT-H. Figure 1. Axial, Sagittal, and Coronal views of the isodoses of the five different Treatment Techniques.
Download
1 / 2
Download Presentation

Télécharger la présentation
NA-IMRT
An Image/Link below is provided (as is) to download presentation
Download Policy: Content on the Website is provided to you AS IS for your information and personal use and may not be sold / licensed / shared on other websites without getting consent from its author.
Content is provided to you AS IS for your information and personal use only.
Download presentation by click this link.
While downloading, if for some reason you are not able to download a presentation, the publisher may have deleted the file from their server.
During download, if you can't get a presentation, the file might be deleted by the publisher.
E N D
Presentation Transcript
Figure2- Dose Volume Histogram Graphs of the CTV and various normal structures. Y-axes represents relative volume and x-axes displays absolute dose.
NA-IMRT A-IMRT CNO CPNI NA-IMRT-H Figure 1. Axial, Sagittal, and Coronal views of the isodoses of the five different Treatment Techniques.


More Related
Audio
Live Player