Download
1 / 1
10 likes | 167 Vues
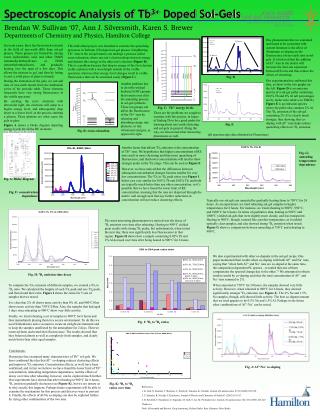
5 D 3. 5 D 3. 5 D 4. 5 D 4. Energy (1000cm -1 ). 620nm. Energy (1000cm -1 ). 590nm. 490nm. 545nm. 436nm. 414nm. 460nm. 18. 18. 20. 22. 24. 26. 28. 30. 12. 22. 20. 10. 26. 14. 12. 10. 24. 28. 30. 16. 14. 16. 7 F 0. 1. 7 F 0. 2. 3. 1. 2. 4. 3. 5. 4. 5.

E N D
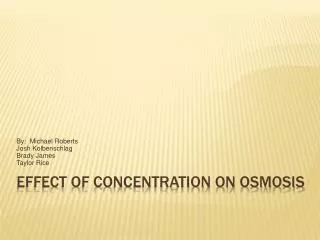
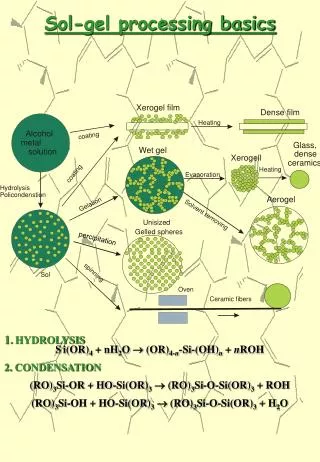
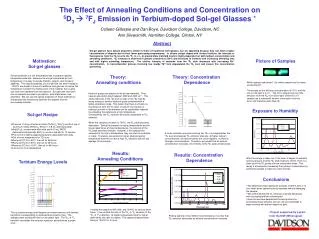
5D3 5D3 5D4 5D4 Energy (1000cm-1) 620nm Energy (1000cm-1) 590nm 490nm 545nm 436nm 414nm 460nm 18 18 20 22 24 26 28 30 12 22 20 10 26 14 12 10 24 28 30 16 14 16 7F0 1 7F0 2 3 1 2 4 3 5 4 5 7F6 7F6 2 4 2 0 0 4 6 8 6 8 The Effect of Annealing Conditions and Concentration on 5D37FJ Emission in Terbium-doped Sol-gel Glasses * Colleen Gillespie and Dan Boye, Davidson College, Davidson, NC Ann Silversmith, Hamilton College, Clinton, NY Abstract Sol-gel glasses have optical properties similar to those of traditional melt glasses, but are appealing because they can hold a higher concentration of dopants due to their lower processing temperatures. In silicate sol-gel doped with trivalent terbium, the intensity of fluorescence from the 5D3 level to the 7FJ (J = 0…6) ground state manifold levels is highly dependent on both terbium concentration and annealing conditions. 5D3 emission is observed in glasses annealed at 750C and increases in intensity with increasing annealing time and with higher annealing temperature. The relative intensity of emission from the 5D3 state decreases with increasing Tb3+ concentration. A cross-relaxation process involving two nearby Tb3+ ions depopulates the 5D3 level and causes this concentration quenching. Motivation: Sol-gel glasses Sol-gel synthesis is a low temperature was to prepare optically transparent materials. Because the sol-gel is prepared at room temperature, it is easy to include metallic, organic, and inorganic additives. The optical properties of a sol-gel that has been heated to ~1000ºC are similar to those of traditional melt glasses, but since this temperature is below the melting point of the material, the sol-gels can hold more dopants than melt glasses. Sol-gels with rare earth ions as dopants are used in phosphors, solid-state lasers, and amplifiers. We can use the optical properties of these materials to characterize the interactions between the dopants and the surrounding material. Picture of Samples Theory: Annealing conditions Theory: Concentration Dependence Which sample looks bluer? So, which sample has the lower concentration? The sample on the left has a concentration of 0.5%, and the one on the right is 0.1%. The 0.5% sample has very little emission from the 5D3 level (blue light) while the 0.1% sample has a substantial amount of emission from this level, and therefore looks blue-ish. Hydroxyl groups are present in the sol-gel materials. They have an absorption band between 2000 and 4000 cm-1. This allows electrons in the 5D3 level to relax to the 5D4 level by losing energy to another hydroxyl group combined with a lattice vibrational mode. This means that there is virtually no fluorescence from the 5D3 level. However, the number of hydroxyl grounds in the material can be significantly reduced by annealing the samples at a high temperature. Consequently, the 5D3 emission becomes comparable to 5D4 emission. When the samples are taken to 750ºC, the 5D3 peak becomes detectable. Taking the samples to higher temperatures and for longer dwell times at those temperatures, the intensity of the 5D3 peak becomes stronger. However, if the samples are annealed at too high a temperature, they can start to crystallize or crack. Therefore, we wanted to find an ideal annealing temperature and time to have a high 5D3 emission without any damage to the sample. Exposure to Humidity Sol-gel Recipe • Dissolve 11.8 mg of terbium nitrate (Tb(NO3)3*5H2O) and 20.3 mg of aluminum nitrate (Al(NO3)3*9H2O) in 7.8 mL deionized water. Add 20 μL concentrated nitric acid and 4.00 mL TMOS (tetramethylorthosilicate, 99%) to solution and stir for 10 minutes Put sol into 4 tightly capped polystyrene disposable test tubes Gel at room temperature for 72 hours Ramp at 5ºC/hr to 60ºC, then sit for 48 hours Ramp at 5ºC/hr to 90ºC, then sit for 48 hours Ramp at 2ºC/hr to 110ºC, then sit for 48 hours Let cool to room temperature A cross-relaxation process involving two Tb3+ ions depopulates the 5D3 level and reduces 5D3 emission intensity. At higher terbium concentrations, the terbium atoms are closer together, so there is stronger cross-relaxation. Therefore, we predict that as terbium concentration increases, the intensity of the 5D3 peak will decrease. Results: Annealing Conditions Results: Concentration Dependence After the sample is taken out of the oven, it begins to reabsorb hydroxyl groups, and the 5D3 peak begins to shrink. Here is a close up of the 5D3 peaks at three consecutive times. This decay is enhanced by increasing the hydroxyl concentration by putting the sample in water for a few minutes. Terbium Energy Levels Conclusions • We determined that heating the samples to 900ºC with a 12 hour dwell gives optimal optical properties without damaging the sample. • We confirmed that the 5D3 emission intensity decreases with increasing terbium concentration • Now that we have determined the best protocol for processing these samples, we can use our knowledge to begin working with erbium-doped sol-gels. I heated the sample to 800, 900, and 1000ºC for various dwell times. I then plotted the ratio of the 5D3 7F4 transition to the 5D4 7F6 transition. At higher temperatures and for higher dwell times, the ratio increases. The sample shattered after being at 1000ºC for 4 hours. • Project supported by a grant • from the NSF-NRI program This is a partial energy level diagram of trivalent terbium, with labeled transitions corresponding to observed fluorescence lines. The samples were excited with 240 nm excitation light. The 5D4 7F5 transition dominates the emission spectrum and produces a green color. Plotting spectra of four different concentrations, it is clear that 5D3 emission decreases as terbium concentration increases.