Two-Sample Testing: Small Samples
Two-Sample Testing: Small Samples.

Two-Sample Testing: Small Samples
E N D
Presentation Transcript
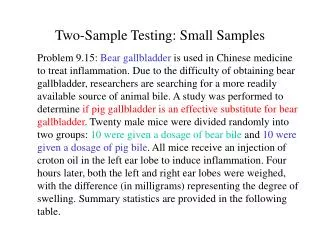
Two-Sample Testing: Small Samples Problem 9.15: Bear gallbladder is used in Chinese medicine to treat inflammation. Due to the difficulty of obtaining bear gallbladder, researchers are searching for a more readily available source of animal bile. A study was performed to determine if pig gallbladder is an effective substitute for bear gallbladder. Twenty male mice were divided randomly into two groups: 10 were given a dosage of bear bile and 10 were given a dosage of pig bile. All mice receive an injection of croton oil in the left ear lobe to induce inflammation. Four hours later, both the left and right ear lobes were weighed, with the difference (in milligrams) representing the degree of swelling. Summary statistics are provided in the following table.
Summary Statistics Question: What conclusion can we make about whether pig bile is an effective substitute for bear bile?
Comparing Means of Several Populations Problem 10.21: Studies conducted at the University of Melbourne indicate that there may be a difference between the pain thresholds of blondes and brunettes. Men and women of various ages were divided into four categories according to hair color: light blond, dark blond, light brunette, and dark brunette. Each person in the experiment was given a pain threshold score based on his/her performance in a pain sensitivity test (higher scores mean higher pain tolerance). The data is provided in the following table.
Data from Experiment Question: Based on this data set, could we conclude that there are differences in the mean pain threshold of blondes and brunettes?
Descriptive Statistics Variable N Mean Median StDev SE Mean LightBlo 5 59.20 60.00 8.53 3.81 DarkBlon 5 51.20 52.00 9.28 4.15 LightBru 4 42.50 41.50 5.45 2.72 DarkBrun 5 37.40 35.00 8.32 3.72 Note: Would usually accompany this summary by a comparative box plots, but since we only have a few observations per group in this example, it is not very appropriate in this case.
Computations of Sum of Squares SS due to Treatment (SSTr) = ni(LMeani - OMean)2 = 5(59.2 - 47.84)2 + 5(51.2 - 47.84)2 + 4(42.5 - 47.84)2 + 5(37.4-47.84)2 = 1360.7264 Lmeani = sample mean of the observations in sample i Omean = overall sample mean of all observations SS due to Error (SSE) = (ni-1)(Si)2 = (5-1)(8.53)2 + (5-1)(9.28)2 + (4-1)(5.45)2 + (5- 1)2(8.32)2 = 1001.5143 Si = sample standard deviation of the observations in sample i
Test Procedure (ANOVA) To test the null H0: m1 = m2 = … = mp versus the alternative H1: at least two means are different, we use the F-test which rejects H0 whenever where Fa;p-1,N-p is the tabular value from the F-distribution with (p-1, N-p) degrees-of-freedom; p is the number of groups, and N = n1 + n2 + … + np is the total number of observations. Or, one may simply compare the p-value (observed significance level) to the nominal level (usually .05).
Analysis of Variance(Using Minitab) Test Statistic One-way Analysis of Variance Analysis of Variance Source DF SS MS F P Factor 3 1360.7 453.6 6.79 0.004 Error 15 1001.8 66.8 Total 18 2362.5 Individual 95% CIs For Mean Based on Pooled StDev Level N Mean StDev ------+---------+---------+---------+ LightBlo 5 59.200 8.526 (-----*------) DarkBlon 5 51.200 9.284 (------*-----) LightBru 4 42.500 5.447 (------*-------) DarkBrun 5 37.400 8.325 (-----*------) ------+---------+---------+---------+ Pooled StDev = 8.172 36 48 60 72 p-value Conclusion: Since the p-value is very small, we can conclude that at least two of the population means are different.
Interpretations If the F-test (ANOVA) fails to reject H0, then you conclude that there are no differences among the population means of the p populations. If the F-test rejects H0, then you conclude that at least two of the population means are different (but not necessarily all of them). You then proceed to examine the individual confidence intervals, or you could perform pairwise t-tests to determine which population means are different. The use of the pairwise t-test will entail an increase in the Type I error, so a more appropriate analysis to detect which means are different uses “multiple comparisons procedures.”