Download
1 / 23
250 likes | 479 Vues
Acid-Base Eqm (6): Titration Curves. Acid-Base Eqm (5): Titration Curves. p.01. Plotting the Titration Curves with your calculated results. E.g. (1a) 25 cm 3 HCl + 20 cm 3 NaOH. 25/1000 0.1 – 20/1000 0.1. = 0.011 M. new [HCl] =. (25+20)/1000. [H 3 O + ] = 0.011 M. pH = 1.95.

E N D
Acid-Base Eqm (6):Titration Curves Acid-Base Eqm (5):Titration Curves p.01 Plotting the Titration Curves with your calculated results. E.g. (1a) 25 cm3 HCl + 20 cm3 NaOH 25/1000 0.1 – 20/1000 0.1 = 0.011 M new [HCl] = (25+20)/1000 [H3O+] = 0.011 M pH = 1.95 C. Y. Yeung (CHW, 2009)
p.02 E.g. (1b) 25 cm3 HCl + 30 cm3 NaOH 30/1000 0.1 – 25/1000 0.1 = 9.0910-3 M [NaOH] = (30+25)/1000 [OH-] = 9.0910-3 M pOH = 2.04 pH = 11.96
p.03 E.g. (2a) 25 cm3 CH3COOH + 20 cm3 NaOH 25/1000 0.1 – 20/1000 0.1 new [CH3COOH] = = 0.011 M (25+20)/1000 20/1000 0.1 [CH3COO-] = = 0.044 M (25+20)/1000 (0.044) pH = - log(1.76 10-5) + log (0.011) = 5.36 [H3O+] = 10-5.36 = 4.37 10-6 M
p.04 E.g. (2b) 25 cm3 CH3COOH + 25 cm3 NaOH 25/1000 0.1 [CH3COO-] = = 0.05 M (25+25)/1000 CH3COO- + H2O CH3COOH + OH- x2 1.00 10-14 = Kb = (0.05 – x) 1.76 10-5 x = 5.33 10-6 = [OH-] pOH = 5.27 pH = 8,73, [H3O+] = 10-8.73 = 1.86 10-9 M
p.05 E.g. (2c) 25 cm3 CH3COOH + 45 cm3 NaOH 45/1000 0.1 – 25/1000 0.1 = 0.0286 M [NaOH] = (45+25)/1000 [OH-] = 0.0286 M pOH = 1.54 pH = 12.5
p.06 E.g. (3a) 25 cm3 HCl + 10 cm3 NH3 25/1000 0.1 – 10/1000 0.1 = 0.043 M new [HCl] = (25+10)/1000 [H3O+] = 0.043 M pH = 1.37
p.07 E.g. (3b) 25 cm3 HCl + 25 cm3 NH3 25/1000 0.1 [NH4+] = = 0.05 M (25+25)/1000 NH4+ + H2O NH3 + H3O+ x2 1.00 10-14 = Ka = (0.05 – x) 1.74 10-5 x = 5.36 10-6 = [H3O+] pH = 5.27 pOH = 8,73, [OH-] = 10-8.73 = 1.86 10-9 M
p.08 E.g. (3c) 25 cm3 HCl + 40 cm3 NH3 40/1000 0.1 – 25/1000 0.1 = 0.0231 M [NH3] = (40+25)/1000 25/1000 0.1 [NH4+] = = 0.0385 M (40+25)/1000 (0.0385) pOH = - log(1.74 10-5) + log (0.0231) pOH = 4.98, [OH-] = 10-4.98 = 1.04 10-5 M pH = 9.02
p.09 abrupt change of pH Titration Curves: Strong Acid VS Strong Base
p.10 pH of salt > 7 A- + H2O HA + OH- abrupt change of pH Titration Curves: Weak Acid VS Strong Base Due to hydrolysis of conjugate base of weak acid:
p.11 BH+ + H2O B + H3O+ pH of salt < 7 abrupt change of pH Titration Curves: Strong Acid VS Weak Base Due to hydrolysis of conjugate acid of weak base:
p.12 weak acid VS strong base strong acid VS strong base strong acid VS weak base Titration Curves: Comparison
8.15 2.70 p.13 3.70 9.15 4.70 10.15 7 7 pH pH Phenolphthalein pink colourless pale pink pKIn± 1 Methyl orange yellow red orange Choosing a Suitable Indicator (1) the abrupt change on the pH curve must fall across the “working range” of the indicator.
p.14 End point: Equivalent point: Choosing a Suitable Indicator (2) The sudden change in colour seen in a titration. The mixture in which amount of acid and base are exactly balance. If the correct indicator has been chosen, the end point will be very close to the equivalent point.
phenolphthalein methyl orange 14 pink p.15 12 pale pink end pt. 10 pH yellow 8 eqv. pt. 6 end pt. colourless orange 4 red 2 0 Strong Acid VS Strong Base vol. of alkali added / cm3 25
phenolphthalein methyl orange 14 pink p.16 12 pale pink 10 pH yellow 8 6 colourless orange 4 red 2 0 Weak Acid VS Strong Base vol. of alkali added / cm3 25
phenolphthalein methyl orange 14 pink p.17 12 pale pink 10 pH yellow 8 6 colourless orange 4 red 2 0 Strong Acid VS Weak Base vol. of acid added / cm3 25
p.18 Explain why phenolphthalein turns pink in a solution of sodium carbonate, but remains colourless in a solution of sodium hydrogencarbonate. [1990]
p.19 The dissociation of which can be represented by HIn(aq) + H2O(l) H3O+(aq) + In-(aq) Explain why at 298K, in a solution of pH7.0, the indicator methyl orange shows its alkaline colour (yellow), while phenolphthalein shows its acidic colour (colourless). [1994] Acid-base indicators are weak acids or bases. The colour of an indicator depends on the relative concentrations of HIn and In- which are of different colours. The dissociation constant KIn of different indicators are different, thus they change colour over different pH range. The pH range of methyl orange is below 7, while that of phenolphthalein is above 7.
p.20 HKALE: p. 233 Q.15(a),(b)
p.21 HKALE: Q.20(a)
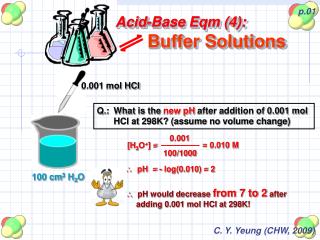
p.22 11.2 cm3 0.1M HCl: Phenolphthalein changes colour. 28.8 cm3 0.1M HCl: Methyl Orange changes colour. E.g. 25cm3 mixture containing NaHCO3 & Na2CO3 11.2 cm3 0.1M HCl to be neutralized first no. of mol of Na2CO3 = 1.1210-3 mol NaHCO3 28.8 cm3 0.1M HCl total no. of mol of NaHCO3 = 2.8810-3 mol NaCl Double Indicator Titration [Phenolphthalein & Methyl Orange] For mixtures containing TWO BASES. • [Na2CO3] = 0.0448 M [NaHCO3] = 0.0704 M Original no. of mol of NaHCO3 = 2.8810-3 – 1.1210-3 = 1.76 10-3 mol
p.23 Next …. Solubility Product (Ksp) [p.172-176] Assignment p.229 Q.3(c), 4, 11, 18, 26, 29 p.171 Check Point 18-4 [due date: 29/4(Wed)]