Melting Point
Melting Point. By Tiffani Chang, Venus Fan, and Jae Kwan Song. Definition. Melting point is the amount of energy required to break a bond to break crystal lattice of a solid and convert it to liquid at 1 atm pressure (crystallization point). Column Trends.


Melting Point
E N D
Presentation Transcript
Melting Point By Tiffani Chang, Venus Fan, and Jae Kwan Song
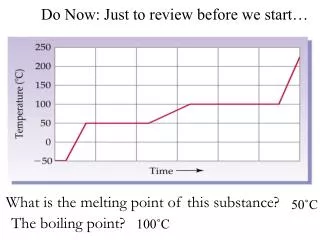
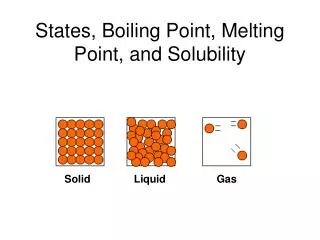
Definition • Melting point is the amount of energy required to break a bond to break crystal lattice of a solid and convert it to liquid at 1 atm pressure (crystallization point).
Column Trends • The trend as we go down the columns varies for each group. • Generally, for transition metal groups, halogens, noble gases, and some nonmetals melting points increase as you move from top to bottom. • For alkali metals and groups around the metalloids, melting points decrease with increasing atomic number.
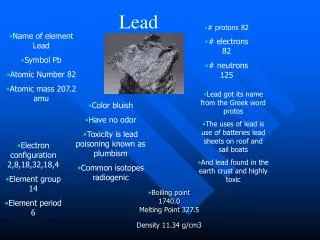
Explanation for Metals • In metal, the intermolecular forces are the metallic bonds. • Since the metallic bond requires more energy compare to Van Der waal force, the energy requires to break the bond between them decreases. • Melting point decreases down the group. • Because of electron shielding, as we move down a column, the neutral force? Becomes weaker decreasing melting points
Explanation for Nonmetals • The intermolecular forces are the vanderwaalforce • More electrons the more distance over which they can move bigger possible temporary dipoles bigger the dispersion forces. • Bigger molecules have more electrons and more distance over which temporary dipoles can develop. • As we go from top to bottom, the size increase and capability of distortion of electronic cloud increases resulting in stronger force of attraction. Hence, both melting point increases down the group.
Exceptions to Column Trends • The Alkali Earth Metals do not have a specific trend. The points decrease, increase (Mg), then decrease. • Group 11, 12, although are transition metals, decrease going down the column • For groups 11, 13, 14, the points decrease but the very last elements of those groups have an increasing point
Periodic Trends • From left to right: the melting point rises to a maximum in the transition metals (columns 5, 6) and then falls of to a minimum value at the end of the period. • The second peak occurs in the Carbon Family except in period 5, it occurs at Sb • In general, melting point decreases as we move from let to right except Period 3. Sulfur only exists as S8, Phosphorous exists as P4, Chlorine exists as Cl2, and Argon exists as Ar. This shows that sulfur contains more electrons than the other elements
Explanation • As we move from left to right, metallic character decreases. Since the metallic bond requires more energy compare to Van Der waal force, the energy requires to break the bond between them decreases. • Metallic character decreases because the increase in radius of the atom which allows the outer electrons to ionize more readily. • The radii follow general periodic trends: they decrease across the period due to increase in the effective nuclear charge, which is not offset by the increased umber of valence electrons.
Units for Trends • Kelvin, Celsius, (Fahrenheit)