Download
1 / 27
270 likes | 466 Vues
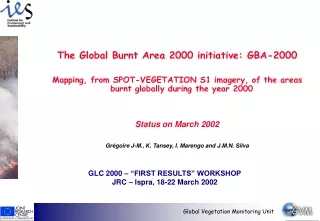
The Global Burnt Area 2000 initiative: GBA-2000 Mapping, from SPOT-VEGETATION S1 imagery, of the areas burnt globally during the year 2000 An overview J-M. Grégoire SAI-GVM June 2001. The Global Burnt Area 2000 initiative: GBA-2000.

E N D
The Global Burnt Area 2000 initiative: GBA-2000 • Mapping, from SPOT-VEGETATION S1 imagery, of the areas burnt globally during the year 2000 • An overview • J-M. Grégoire • SAI-GVM • June 2001
The Global Burnt Area 2000 initiative: GBA-2000 • A contribution to the Global Land Cover (GLC 2000) initiative • In response to the needs for environmental assessment of the • interactions • between biomass burning and land cover change: • Biodiversity, Desertification and Climate Change Conventions • between biomass burning and emissions of GHG & aerosols: • Climate Change Convention
Biomass burning & land cover type/conditions three main situations • Regular & frequent burning is a characteristic of the land cover class • some kind of equilibrium between burning & land cover • example: African savannas of the Sudanian domain • Due to land use change, regular & frequent burning did appear recently, but is not a characteristic of the current land cover class • there is a progressive modification of the land cover type or conditions • example: degraded tropical forests • Burning is an exceptional event, and certainly not a characteristic • of the land cover class • there is a drastic & sudden modification of the land cover • example: fire events in evergreen rainforests of the tropical belt
GBA-2000 Product definition • a binary map (burnt-unburnt) monthly non-accumulative global burn scar map, at 1 km resolution • statistics of burnt areas area burnt in 2000 per country, per month, and • per main types of vegetation cover (IGBP-DIS, Hansen et al., …….)
GBA-2000 General approach • Selection of a limited number of co-investigators : 8 • criteria: access to validation data sets & field expertise/contacts • Development of regional algorithms for processing VGT S1 imagery • to burnt area maps • Integration of the regional algorithms into a global processing chain at JRC
GBA 2000 Co-Investigators CSIRO(AU) - UTL(P) - NRI(UK) - CNR(I) - CCRS (CA) - CRG (CA) - IFI (RU) - SAI (EU) 68N - 45E 60N - 60E (IFI) 63N - 81W 44N - 55W (CRG) 62.5N-112W 57N-104.5W (CCRS) 60N - 118E 48N - 140E (IFI) 44N - 10W 36N - 0 (UTL) 55N - 115E 40N - 135E (UTL) 10S - 125E 18S - 146E (GVM) 18N - 93W 7N - 77W (NRI) 18N - 18W 0 - 52E (CNR) 5S - 75W 20S - 45W (UTL) 10S - 22E 28S - 42E (UTL) 11S - 125E 21S - 135E (CSIRO) 17S - 21E 28S - 29E (NRI) GBA test-sites (white rectangles; indicative position), with corresponding geographical coordinates (Ul; LR corners)
Who is responsible for what ? • SAI-GVM • purchase of the SPOT-VGT S1 time series (costs shared with CNES) • delivery (FTP, DAT, DLT …etc) of the regional datasets • contribute to the purchase of high resolution imagery for validation • implementation of the regional algorithms into a global processing chain • overall co-ordination • Regional Co-Investigators • development & test of the regionally adapted algorithms • performance assessment of the algorithms • delivery of the algorithms to GVM • contribution (tbd) to the validation of the end product
Action plan & schedule July 00 Jan 01 July 01 Dec 01 July 02 • Data delivery to Co-I • Development & test of regional algorithms • Performance assessment • of regional algorithms • Consensus on set of regional algorithms • Integration of regional algo. into proc. chain • Generation of the GBA product • Accuracy assessment of the GBA product • Product dissemination
GBA-2000 Methodological component
Pre-processing of the SPOT-VGT S1 time series • Masking • for clouds & cloud shadows (adapted fromKempeneers et al.,2000) • for extreme viewing zenith angles (> 50o) • for max. NDVI composite areas (+/- 32o Lat.) • for non-burnable areas • . IGBP-DIS (EDC/USGS) • . Simple Biosphere Model 2 (EDC) • . Maryland Global Landcover Dataset (Hansen et al., 2000)
Processing of the SPOT-VGT S1 to burnt area maps 3 approaches currently tested All based on change detection techniques in NIR, SWIR & NDWI • Supervised temporal change detection techniques, on a pixel basis • applied to single date images (NRI, Flasse et al.; UTL, Pereira et al.) • non consecutive images: 5-day cycle (Boschetti et al., 2001) • Supervised temporal change detection techniques, on a pixel basis • applied to composite images (JRC, Stroppiana et al., 2001; IFI, Ershov et al.) • compositing = 10-day, min NIR • Supervised temporal change detection techniques, on a pixel basis but • with a spatial dependency (CNR, Brivio et al.) • applied to single date images • contextual window 3x3 • neural network approach
GBA-2000 Validation component
Guidelines for validation ref. Document prepared by NRI and CNR, and distributed by e_mail GBA2000-Algorithm performance & final product assessment Comments and suggestions (NRI and CNR, 21 February 2001)
Performance analysis • of the algorithm • regression estimator, over the regions • covered by TM data • overall accuracy • omission & comission errors of the classification • evaluation, on a grid basis over the • entire region classified to BA • Output • for each classification • overall accuracy of the map • overall accuracy of the algorithm • levels of under and overestimation
Performances of the algorithm BA map derived from high resolution imagery (TM) Set of BA maps derived from SPOT-VGT 1 map for each classification tool Samples (14 x 14 km) randomly distributed Regression estimator regression line: overall accuracy 1 to 1 line: level of omission and comission errors
GBA 2000: validation sites West Russia / IFI Siberia / IFI + UTL Canada / CCRS Portugal / UTL Mexico / NRI Central Af. Rep. / CNR Guinea / CNR Mozambic / UTL Niamibia Botswana / NRI Australia / JRC + CSIRO GBA validation sites, with corresponding co-investigators
Performance analysis Region: Africa N-Eq. (sub-window 1) Co-I: CNR (Milan) Site(s): TM 201/52 10/12/99 TM 201/54 15/03/00 TM 200/53 19/12/99 & 08/03/00 TM 199/53 12/12/99 TM 198/54 21/12/99
Performance analysis Region: Africa N-Eq. (sub window 2) Co-I: CNR (Milan) Site(s): TM 181/57 03/03/00 TM 179/56 30/11/99 & 06/04/00 TM 177/56 16/11/99 & 04/02/00 TM 177/57 02/12/99
Performance analysis Australia Co-I: GVM (Ispra) EOC (Canberra) Site(s): TM from 1999 105/69-70; 104/69-70 TM from 2000 105/070 02 - 18 /05/00 03 - 19 /06/00 05 - 21 /07/00 06 - 22 /08/00 07 - 23 /09/00 113/075 08/07/00 02/11/00 110/072 08/07/00 10/09/00 098/070 20/07/00 06/09/00 089/082 22/09/00 11/12/00
Performance analysis Russia & Siberia study-sites (IFI)
Performance analysisFar East Siberia Co-I: IFI (Moscow) UTL (Lisbon) Site(s): TM 124/22 11/08/00 TM 118/23 14/06/00
Performance analysis Mozambic Co-I: UTL (Lisbon) Site(s) TM 165/70 10/08/00 11/09/00 27/09/00
Performance analysis Iberic Peninsula Co-I: UTL (Lisbon) Site(s) TM 204/31 6/10/00 TM 204/32 6/10/00 TM 204/33 6/10/00 TM 204/34 6/10/00 23/10/00 TM 203/31 7/10/00 TM 203/32 7/10/00 TM 203/33 7/10/00
179-74 174-74 Performance analysis Namibia-Botswana Co-I: NRI (Chatham) Site(s) TM 179/74 12/08/00 31/10/00 TM 174/74 10/09/00 20/10/00
30-45 33-40 Performance analysis Mexico Co-I: NRI (Chatham) Site(s) TM 30/45 18/04/00 20/05/00 TM 33/40 23/04/00 25/05/00
Performance analysis Canada Co-I: CCRS (Ottawa) Site(s) TM 43-17 16/06/00 04/09/00 TM 40-18 15/09/00 TM 41-18 18/09/99
GBA-2000 Status on June 2001 • Data distribution to co-investigatorscompleted • Development of regional algorithms • + completed for . Australia test-site • . Africa, Namibia/Botswana site • . Africa, Northern hemisphere • + initiated for . Africa, Mozambic test-site • . Russia, Far East Siberia • . Canada • + evaluation during the GOFC-Fire workshop, Lisbon, July 9-11 • Performance analysis + initiated for Australia & Africa • Global processing chain at JRC • + pre-processing module completed • + processing module: tests started over . African continent • . Australia