Download
1 / 1
10 likes | 140 Vues
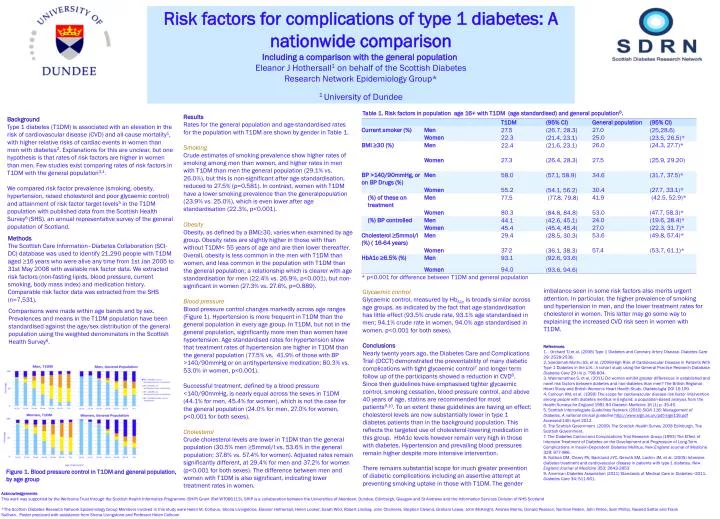
Risk factors for complications of type 1 diabetes: A nationwide comparison Including a comparison with the general population Eleanor J Hothersall 1 on behalf of the Scottish Diabetes Research Network Epidemiology Group* 1 University of Dundee. Results

E N D
Risk factors for complications of type 1 diabetes: A nationwide comparison Including a comparison with the general population Eleanor J Hothersall1 on behalf of the Scottish Diabetes Research Network Epidemiology Group* 1 University of Dundee Results Rates for the general population and age-standardised rates for the population with T1DM are shown by gender in Table 1. Smoking Crude estimates of smoking prevalence show higher rates of smoking among men than women, and higher rates in men with T1DM than men the general population (29.1% vs. 26.0%), but this is non-significant after age standardisation, reduced to 27.5% (p=0.581). In contrast, women with T1DM have a lower smoking prevalence than the generalpopulation(23.9% vs. 25.0%), which is even lower after age standardisation (22.3%, p<0.001). Background Type 1 diabetes (T1DM) is associated with an elevation in the risk of cardiovascular disease (CVD) and all-cause mortality1, with higher relative risks of cardiac events in women than men with diabetes2. Explanations for this are unclear, but one hypothesis is that rates of risk factors are higher in women than men. Few studies exist comparing rates of risk factors in T1DM with the general population3,4. We compared risk factor prevalence (smoking, obesity, hypertension, raised cholesterol and poor glycaemic control) and attainment of risk factor target levels5 in the T1DM population with published data from the Scottish Health Survey6 (SHS), an annual representative survey of the general population of Scotland. Obesity Obesity, as defined by a BMI≥30, varies when examined by age group. Obesity rates are slightly higher in those with than without T1DM< 55 years of age and are then lower thereafter. Overall, obesity is less common in the men with T1DM than women, and less common in the population with T1DM than the general population; a relationship which is clearer with age standardisation for men (22.4% vs. 26.9%, p<0.001), but non-significant in women (27.3% vs. 27.6%, p=0.889). Blood pressure Blood pressure control changes markedly across age ranges (Figure 1). Hypertension is more frequent in T1DM than the general population in every age group. In T1DM, but not in the general population, significantly more men than women have hypertension. Age standardised rates for hypertension show that treatment rates of hypertension are higher in T1DM than the general population (77.5% vs. 41.9% of those with BP >140/90mmHg or on antihypertensive medication; 80.3% vs. 53.0% in women, p<0.001). Successful treatment, defined by a blood pressure <140/90mmHg, is nearly equal across the sexes in T1DM (44.1% for men, 45.4% for women), which is not the case for the general population (24.0% for men, 27.0% for women, p<0.001 for both sexes). Cholesterol Crude cholesterol levels are lower in T1DM than the general population (30.5% men ≥5mmol/l vs. 53.6% in the general population; 37.8% vs. 57.4% for women). Adjusted rates remainsignificantly different, at 29.4% for men and 37.2% for women (p<0.001 for both sexes). The difference between men and women with T1DM is also significant, indicating lower treatment rates in women. Methods The Scottish Care Information–Diabetes Collaboration (SCI-DC) database was used to identify 21,290 people with T1DM aged ≥16 years who were alive any time from 1st Jan 2005 to 31st May 2008 with available risk factor data. We extracted risk factors (non-fasting lipids, blood pressure, current smoking, body mass index) and medication history. Comparable risk factor data was extracted from the SHS (n=7,531). imbalance seen in some risk factors also merits urgent attention. In particular, the higher prevalence of smoking and hypertension in men, and the lower treatment rates for cholesterol in women. This latter may go some way to explaining the increased CVD risk seen in women with T1DM. Glycaemic control Glycaemic control, measured by HbA1cis broadly similar across age groups, as indicated by the fact that age standardisation has little effect (93.5% crude rate, 93.1% age standardised in men; 94.1% crude rate in women, 94.0% age standardised in women, p<0.001 for both sexes). Comparisons were made within age bands and by sex. Prevalences and means in the T1DM population have been standardised against the age/sex distribution of the general population using the weighted denominators in the Scottish Health Survey6. Conclusions Nearly twenty years ago, theDiabetes Care and Complications Trial (DCCT) demonstrated the preventability of many diabetic complications with tight glycaemic control7and longer term follow up of the participants showed a reduction in CVD8. Since then guidelines have emphasised tighter glycaemic control, smoking cessation, blood pressure control, and above 40 years of age, statins are recommended for most patients9,10. To an extent these guidelines are having an effect: cholesterol levels are now substantially lower in type 1 diabetes patients than in the background population. This reflects the targeted use of cholesterol-lowering medication in this group. HbA1c levels however remain very high in those with diabetes. Hypertension and prevailing blood pressures remain higher despite more intensive intervention. There remains substantial scope for much greater prevention of diabetic complications including an assertive attempt at preventing smoking uptake in those with T1DM. The gender References 1. . Orchard TJ et al. (2006) Type 1 Diabetes and Coronary Artery Disease. Diabetes Care 29: 2528-2538. 2. Soedamah-Muthu SS, et al. (2006)High Risk of Cardiovascular Disease in Patients With Type 1 Diabetes in the U.K.: A cohort study using the General Practice Research DatabaseDiabetes Care 29 (4) p. 798-804. 3. Wannamethee S, et al. (2011) Do women exhibit greater differences in established and novel risk factors between diabetes and non-diabetes than men? The British Regional Heart Study and British Women's Heart Health Study. Diabetologia DOI 10.100. 4. Colhoun HM, et al. (1999) The scope for cardiovascular disease risk factor intervention among people with diabetes mellitus in England: a population-based analysis from the Health Surveys for England 1991-94 Diabetic Medicine 16 (1) p. 35-40. 5. Scottish Intercollegiate Guidelines Network (2010) SIGN 116: Management of Diabetes. A national clinical guideline http://www.sign.ac.uk/pdf/sign116.pdf Accessed:14th April 2012. 6. The Scottish Government (2009) The Scottish Health Survey 2008 Edinburgh, The Scottish Government. 7. The Diabetes Control and Complications Trial Research Group (1993) The Effect of Intensive Treatment of Diabetes on the Development and Progression of Long-Term Complications in Insulin-Dependent Diabetes Mellitus. New England Journal of Medicine 329: 977-986. 8. Nathan DM, Cleary PA, Backlund J-YC, Genuth SM, Lachin JM, et al. (2005) Intensive diabetes treatment and cardiovascular disease in patients with type 1 diabetes. New England Journal of Medicine 353: 2643-2653. 9. American Diabetes Association (2011) Standards of Medical Care in Diabetes—2011. Diabetes Care 34: S11-S61. Figure 1. Blood pressure control in T1DM and general population, by age group Acknowledgements This work was supported by the Wellcome Trust through the Scottish Health Informatics Programme (SHIP) Grant (Ref WT086113). SHIP is a collaboration between the Universities of Aberdeen, Dundee, Edinburgh, Glasgow and St Andrews and the Information Services Division of NHS Scotland *The Scottish Diabetes Research Network Epidemiology Group Members involved in this study were Helen M. Colhoun, Shona Livingstone, Eleanor Hothersall, Helen Looker, Sarah Wild, Robert Lindsay, John Chalmers, Stephen Cleland, Graham Leese, John McKnight, Andrew Morris, Donald Pearson, Norman Peden, John Petrie, Sam Phillip, Naveed Sattar and Frank Sullivan. Poster produced with assistance from Shona Livingstone and Professor Helen Colhoun Sex Differences in CVD Risk factor Profiles in those with Type 1 Diabetes in Scotland Helen Colhoun1 on behalf of the Scottish Diabetes Research Network Epidemiology Group* 1 University of Dundee Background and Aims We have already reported that Type 1 diabetes increases CVD risk in both sexes, and that the effect and associated Relative Risks of CVD with Type 1 are much higher in women1. To explore possible reasons for this we compared CVD risk factors and achievement of treatment targets in male and female Type 1 subjects using a recent study population of nearly all Type 1 diabetic subjects living in Scotland in May 2008. Methods We used clinical and issued prescriptions data from the Scottish Care Initiative-Diabetes Collaboration (SCI-DC) which captures data on the majority of patients with diabetes in Scotland, to take a cross-sectional look at the subpopulation of Type 1 subjects aged 20 and older, in the most recent SCI-DC extract of May 31st 2008. Women were compared against men using logistic models for binary variables, multinomial logit models for categorical variables and median regression for continuous variables; all comparisons were adjusted for age and diabetes duration adjustment. Analyses were restricted to those aged 20 and over. Results In the most recent SCI-DC extract of 31st May 2008 21, 014 men and 9,276 (43.6%) women aged 20 and older were alive with Type 1 diabetes. The median age was 42.9 (32.9-52.9) overall, 42.9 (32.9-52.9) years in men and 42.9 (32.9-53.9) years in women. Apart from slightly more women aged 60 and older (15.4% compared to 12.8%, adjusted p-value<0.001), the age distribution was similar by sex. Duration was longer in women by an average of 1.5 years with an adjusted p-value of <0.001 for sex difference. The median diabetes duration was 18.4 (10.3-28.4) overall, 18.4 (9.4-28.4) in men and 19.4 (11.2-29.4) in women. Blood pressure The median systolic blood pressure (SBP) was 130 (120-140) mmHg overall, 130 (120-140) in men and 128 (116-140) in women. The sex difference varied considerably with age group. Systolic blood pressure was lower in women under age 60, by an average of 6.3 units in those aged 20-39 (p<0.001), by 2.2 units in those aged 40-59 (p<0.001) , but was similar in men and women aged 60 and older (p=0.283). The median diastolic blood pressure (DBP) was 75 (68-80) mmHg overall, 76 (70-81) in men and 74 (67-80) in women. DBP was lower in women , by 1.2 , 2.9 and 1.1 units in age groups 20-39, 40-59 and 60 and older respectively (adjusted p<0.001 in each case). The prevalence of hypertension defined at 130/80 was similar across sexes, showing increasing prevalence with age. Levels of untreated, uncontrolled hypertension decreased with age, and while treatment overall rose considerably, the majority of those identified as hypertensive age 60 or over were not controlled (Figure 1). Figure 1. Blood pressure categories by age and sex. Cholesterol Across all age groups, women had higher cholesterol than men (p<0.001 for all age groups, but the age and sex adjusted relationship was not significant (p=0.543) (Figure 2). Statin prescription was higher in men than women until over 60, when a higher proportion of women received statins (Table 1). Figure 2. Cholesterol by age and sex Glycaemic control Glycaemic control, measured by HbA1c, showed similar distribution between the sexes (Figure 3), but more men than women achieved glycaemic control, whether using a cut off of <7% or <7.5% (p<0.001 in both cases). This applied across all age groups. Figure 3. HbA1c by age and sex Renal function Renal disease (as defined by a recent eGFR<60ml/min/1.73m2 or a prior renal admission) was more prevalent in women (20.9% compared to 12.9% , adjusted P-value<0.001)(Table 1). Obesity Obesity was more common in women than men in all age groups. Figure 4. Comparison of Obesity prevalence in Women versus Men by Age group Smoking Prevalence of current smoking was lower in women in all age groups (p<0.001)(Figure 5), although the magnitude of the effect varied by age band (Table 1). Figure 5. Smoking status by gender Conclusions The worse risk factor profile for obesity, glycaemic control and renal function in women than men with type 1 DM may contribute to their greater elevation in CVD risk. Acknowledgements This work was supported by the Wellcome Trust through the Scottish Health Informatics Programme (SHIP) Grant (Ref WT086113). SHIP is a collaboration between the Universities of Aberdeen, Dundee, Edinburgh, Glasgow and St Andrews and the Information Services Division of NHS Scotland The Scottish Diabetes Research Network Epidemiology Group Members are: Shona Brearly, Andrew Briggs, John Chalmers, Helen Colhoun, Scott Cunningham, Alistair Emslie-Smith , Colin Fischbacher, Bruce Guthrie, Graham Leese, Robert Lindsay, Ritchie McAlpine , Mark McGilchrist, John McKnight, Andrew Morris, Donald Pearson, John Petrie, Sam Philip, Naveed Sattar, Frank ullivan and Sarah Wild. References 1. Soedamah-Muthu SS, Fuller JH, Mulnier HE, Raleigh VS, Lawrenson RA, Colhoun HM. High risk of cardiovascular disease in patients with type 1 diabetes in the U.K.: a cohort study using the general practice research database. Diabetes care. 2006;29(4):798–804. • Table 1. Risk factor levels† in all those with T1DM aged =20 by age and sex • Men • Women • Age, years • 20-39 • 40-59 • 60+ • Total • 20-39 • 40-59 • 60+ • Total • n=5,217 • n=5,260 • n=1,537 • n=12,014 • n=4,060 • n=3,789 • n=1,427 • n=9,276 • Diabetes duration, years • 12.9 (6.4–20.4) • 22.4 (13.3–31.4) • 31.0 (18.4–41.4) • 18.4 (9.4–28.4) • 14.4 (7.6–21.4) • 24.4 (15.3–33.0) • 30.4 (16.6–42.4) • 19.4 (11.2–29.4) • <0.001 • Systolic BP mmHg • 128 (119–137) • 132 (122–142) • 137 (126–147) • 130 (120–140) • 121 (111–131) • 130 (120–140) • 138 (127–148) • 128 (116–140) • <0.001 • Diastolic BP, mmHg • 76 (70–81) • 77 (70–82) • 71 (64–79) • 76 (70–81) • 75 (68–80) • 74 (68–80) • 70 (63–78) • 74 (67–80) • <0.001 • Total Cholesterol, • mmol/L • 4.6 (4.0–5.3) • 4.4 (3.8–5.1) • 4.0 (3.5–4.6) • 4.4 (3.9–5.1) • 4.8 (4.2–5.4) • 4.6 (4.0–5.2) • 4.4 (3.9–5.0) • 4.6 (4.1–5.3) • <0.001 • Triglyceride, mmol/L • 1.3 (0.9–2.0) • 1.2 (0.9–1.8) • 1.2 (0.8–1.7) • 1.2 (0.9–1.9) • 1.1 (0.8–1.7) • 1.0 (0.7–1.5) • 1.1 (0.8–1.6) • 1.1 (0.8–1.6) • <0.001 • HDL Cholesterol, mmol/L • 1.3 (1.1–1.6) • 1.4 (1.1–1.7) • 1.4 (1.1–1.7) • 1.4 (1.1–1.6) • 1.5 (1.3–1.8) • 1.7 (1.3–2.0) • 1.7 (1.4–2.1) • 1.6 (1.3–1.9) • <0.001 • Renal Disease • 6.6 (0.36) • 13.3 (0.48) • 31.9 (1.21) • 12.9 (0.32) • 10.8 (0.51) • 20.1 (0.67) • 49.6 (1.34) • 20.9 (0.43) • <0.001 • HbA1c, % • 8.6 (7.5–9.7) • 8.4 (7.5–9.4) • 8.1 (7.3–9.0) • 8.4 (7.5–9.5) • 8.5 (7.5–9.8) • 8.6 (7.7–9.6) • 8.3 (7.4–9.3) • 8.5 (7.6–9.6) • 0.001 • BMI, kg/m2 • 25.7 (23.1–29.0) • 27.3 (24.6–30.2) • 27.1 (24.3–30.1) • 26.6 (23.9–29.7) • 26.2 (23.4–30.1) • 27.0 (23.9–31.3) • 26.8 (23.6–30.7) • 26.6 (23.6–30.7) • <0.001 • Current smoker, • 33.2 (0.68) • 29.9 (0.65) • 19.1 (1.02) • 29.9 (0.43) • 24..9 (0.70) • 26.8 (0.73) • 15.4 (0.98) • 24.6 (0.46) • <0.001 • On regular aspirin • 6.4 (0.35) • 36.2 (0.68) • 59.9 (1.28) • 26.6 (0.42) • 4.9 (0.35) • 29.8 (0.76) • 54.2 (1.36) • 22.9 (0.45) • <0.001 • On a statin • 17.3 (0.55) • 58.8 (0.70) • 72.8 (1.16) • 43.0 (0.47) • 13.4 (0.56) • 54.7 (0.83) • 73.6 (1.20) • 39.9 (0.53) • <0.001 • On anti-hypertensive medication • 18.5 (0.56) • 49.7 (0.71) • 79.4 (1.06) • 40.3 (0.46) • 15.4 (0.59) • 43.5 (0.83) • 79.4 (1.10) • 36.9 (0.52) • <0.001 • Of treated, those on an ACE • inhibitor • 80.3 (1.34) • 76.2 (0.86) • 70.9 (1.33) • 75.6 (0.64) • 66.8 (1.99) • 65.3 (1.20) • 60.9 (1.50) • 64.1 (0.85) • <0.001 • †Values are median (25th-75th percentile) for continuous variables, % (standard error) for categorical variables • * Numbers varied slightly for available data for different risk factors • P value for difference • between sexes