Scientific Method and Metric System
110 likes | 313 Vues
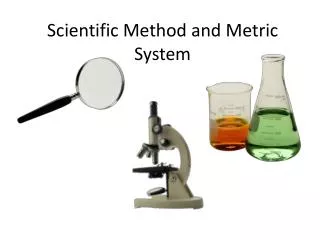
Scientific Method and Metric System. Metric Measurements. Remember the American Choppers ’ confusion with English measurements?!? Always measure mass in grams, distance in meters, volume in liters, temperature in º C, and time in seconds

Scientific Method and Metric System
E N D
Presentation Transcript
Metric Measurements • Remember the American Choppers’ confusion with English measurements?!? • Always measure mass in grams, distance in meters, volume in liters, temperature in ºC, and time in seconds • Remember how to convert from one unit to another using the metric staircase (count stairs and remember the direction to move decimal point)
Observation Skills • Observation skills in the Clue-style clip & Basketball clip. • QUALITative observations: based on the QUALITIES of an object using 5 senses • QUANTITative observations: when you count or measure QUANTITIES of an object • Inferences: logical statements that attempt to explain the pattern of observations using prior knowledge.
Precision vs. Accuracy • Precision: exactness of a measurement • Accuracy: a description of how close a measurement is to the true value of the quantity measured • Ex: If you measure the long jump with a tape measure that has a broken tip (top), you can still read 4.14m PRECISELY. But that number is not ACCURATE because it’s not the actual distance of the jump.
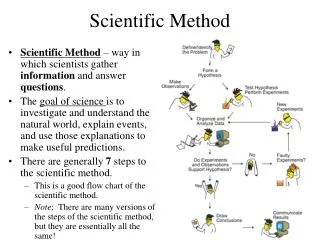
Parts of the Scientific Method • Scientific Method: a logical, scientific approach to problem solving • Testable question: question that asks how changing one variable will affect results • Purpose: written as “To observe…” or “To measure…” • Hypothesis: a 3 part sentence that describes the experiment, makes a prediction and presents an educated guess to explain predicted results • How does increasing the hole in a parachute affect drop time? • To observe how increasing the diameter of the hole affects parachute drop time.
Scientific Method 2 • Independent variable: the factor “I” change in an experiment • Dependent variable: Data collected when experimenting • Standardizing variables: parts of exper. NOT influenced by the IV; Stuff that Stays the Same • Control group: thegroupthat receives no treatment or a standard treatment…gives baseline reading for comparing results I: parachute hole diameter D: drop time SV: drop height, parachute mass, length of strings, etc CG: unaltered parachute with standard hole size (compare data to this!)
Writing a Hypothesis • If the independent variable is increased/decreased (choose one!)… • Then the dependent variable will increase/decrease (predict only one!)… • Because of “this scientific principle” (you will need to do some research for this!) • Ex: If the size of the hole in a parachute is increased then its drop time will decrease because air resistance will decrease allowing the parachute to fall faster.
Data • Recorded in a data table • At least 3 columns of test groups w/units • 10 trials listed w/average row! • Analyzed using graphs: • Pie chart: comparing percentages • Bar graph: comparing values • Line graphs: showing trends between the independent variable and the dependent variable • Plot only averages! • X axis has the indep. variable • Y axis has the dep. variable
Parts of a Conclusion • Rewrite your hypothesis word for word! • Describe to the reader the trend shown in the graph. Use qualit.(observ.) and quantit. (#) data! • Explain the science that rationalizes the trend you saw. • Provide 2 sources of error that may have thrown off your data
Use formal writing: No I, me, my or you! • I think the reason for the results…. • You need to gather your materials…. • My results show… • One possible reason for the results… • Gather the following materials… • The results show…