Download
1 / 36
520 likes | 1.46k Vues
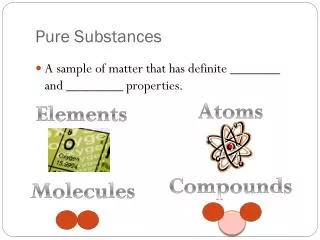
Properties Of Pure Substances. Z. f(X,Y,Z ) = 0. Y. X. Description of thermodynamic state. State Postulate:. The equilibrium state of a simple, pure substance can be determined by any two independent, intrinsic properties. f(P,v,T) = 0 p = p(v,T) T=T(P,v) v= v(P,T).

E N D
Properties Of Pure Substances
Z f(X,Y,Z) = 0 Y X Description of thermodynamic state State Postulate: • The equilibrium state of a simple, pure substance can be determined by any two independent, intrinsic properties f(P,v,T) = 0 p = p(v,T) T=T(P,v) v= v(P,T) Simple compressible systems
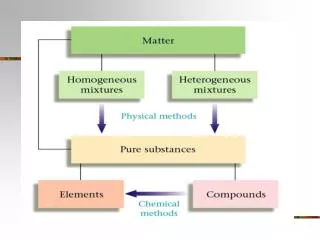
Simple system: • A simple system is one in which the effects of motion, viscosity, fluid shear, capilliarity, anisotropic stress, and external force fields are absent. • Homogeneous substance: • A substance that has uniform thermodynamic properties throughout. • Pure substance: • A pure substance has a homogeneous and invariable chemical composition and may exist in more than one phase. • Phase: • A phase is identified as having a distinct molecular arrangement which is homogeneous throughout, and separated from the others by easily identifiable boundary surfaces.
Water Vapour Liquid water • Mixture of liquid water and water vapour. Examples of Pure substances Water Vapour Ice Liquid water • Water (solid, liquid, and vapour phases) CO2 Air Carbon dioxide, CO2 (or nitrogen, N2, or helium, He etc…) Mixture of gases, such as air, because it has a uniform chemical composition (as long as there is no change of phase)
Oil water Examples of substances that cannot be considered pure substances • Mixture of oil and water • Oil is not soluble in water, forming two chemically dissimilar regions • Composition of liquid air is different from the composition of gaseous air • Chemically not homogeneous Reason: different components in air condensing at different temperatures at a specified pressure. Gaseous air Liquid air
Phase-change processes of pure substances Heating of liquid water from 20oC at 1 atm while keeping the pressure constant • State 1 is a liquid phase usually referred to as compressed liquid or subcooled liquid state (i.e. not about to vapourise) • As heat is added, T and v will increase until saturated liquid state 2 • In the compressed liquid state, the properties of the liquid ≈ the properties of the saturated liquid state at the temperature
At state 2, liquid reached boiling temperature (saturation temperature) i.e. about to vapourise • As heat is added, phase change occurs. T and P remain constant (water boils at 100oC when pressure is 1 atm) • At state 3 the liquid and vapour phase are in equilibrium. • During boiling process, large increase in volume and a steady decline in liquid level is observed.
At state 4 vapourisation is complete and a saturated vapour exist (i.e. a vapour that is about to codense) • Any removal of heat from state 4 will cause the vapour to condense. • A substance between 2 and 4 is often referred to as a saturated liquid–vapour mixture(since the liquid and vapour phases coexist in equilibrium at these states)
Once phase change is complete at state 4, only a single phase exist i.e. vapour • Further heating results in an increase in the temperature above the saturation temperature, 100oC. The volume also increases. • Stae 5 is called a superheated vapour state i.e. the vapour is not about to condense
Superheating and microwave ovens • There have been many reports of injury to people using microwave ovens to heat water to make hot drinks. • Water heated in a microwave oven may be superheated and when objects (e.g. a spoon) or granulated materials (e.g. instant coffee) are put into it, the water may boil very vigorously or even appear to explode out of the container. • The vigorously ejected boiling water can cause serious burns. Time = t t+ 1/30 s t+ 2/30 s t+ 3/30 s
Water doesn't always boil (bubbling) when it is heated above its normal boiling temperature (100 °C or 212 °F). • If no bubbles form, then boiling will simply remain a possibility, not a reality. • Something has to trigger the formation of steam bubbles, a process known as "nucleation." • If there is no nucleation of steam bubbles, there will be no boiling and therefore no effective limit to how hot the water can become. • Nucleation usually occurs at hot spots during stovetop cooking or at defects in the surfaces of cooking vessels. • Glass containers have few or no such defects. When you cook water in a smooth glass container, using a microwave oven, it is quite possible that there will be no nucleation on the walls of the container and the water will superheat.
Some quantitative details • The latent heat of vapourization of water is L = 2.23 MJ/kg. This means that it takes 2,230,000 Joules of heat to evaporate 1 kg of water at 100 °C and at normal atmospheric pressure. (One kilogramme of water is about one litre.) • The specific heat capacity of water is c = 4.2 kJ/kg. This means that it takes 4,200 Joules of heat to raise the temperature of 1 kg of water by 1 °C. • Suppose that we heat one kilogram of water from 100 °C (its normal boiling temperature) to 101 °C, i.e. it is now superheated by 1 °C. • When it begins to boil, it will very quickly cool to 100 °C, and the heat liberated turns water into steam. • Cooling this kg of water by 1 °C gives 4.2 kJ, which is enough to evaporate c/L = 4200/2230000 kg of water. This is only 1.9 ml of water, which does not sound very much, but it turns into 3 litres of steam. • Those three litres of steam are created inside the hot water, quite suddenly, so the water is ejected violently from the container.
“water boils at 100oC” Strictly speaking, incorrect! Saturation Temperature and Saturation Pressure “water boils at 100oC at 1 atm pressure” Correct statement should be: The temperature at which water starts boiling depends on the pressure; therefore, if the pressure is fixed, so is the boiling temperature At a given pressure, the temperature at which a pure substance changes phase is called the saturation temperature Tsat Likewise, at a given temperature, the pressure at which a pure substance changes phase is called the saturation pressure Psat At P=101325 kPa, Tsat = 100oC At T=100oC, Psat = 101325 kPa
Psat (kPa) T sat (oC) During a phase-change process, P and T are dependent properties i.e. Liquid-vapour saturation curve
Repeating the phase-change process at other constant pressures: T-v diagram of constant-pressure phase-change processes of a pure substance at various pressures(numerical values are for water).
Critical point: defined as the point at which the saturated liquid and vapour states are identical For water: Pcr=22.09 MPa, Tcr=374.14oC,vcr=0.003155m3kg-1 At supercritical pressures (P>Pcr) there is no distinct phase-phase change (boiling) process. Above the critical state, there is no line that separates the compressed liquid region and the superheated vapour region • Customary to refer a substance at: • T>Tcr superheated vapour • T<Tcr compressed liquid
If all the saturated liquid states are connected saturated liquid line • If all the saturated vapour states are connected saturated vapour line T-v diagram of a pure substance
The properties of saturated liquid and saturated vapour of substances are listed in tables. Partial list of the saturated water-temperature table
Extending the diagrams to include the solid phase: P-v diagram of a substance that contracts on freezing.
P-v diagram of a substance that expands on freezing (such as water).
Each phase is stable only in a certain ranges of T and P • Transition takes place under condition of phase equilibrium between two phases (and for a given P,this occurs at a specific T) • Triple-point: • For P < Ptp, no liquid phase • e.g. CO2 : Ptp ~ 5 atm at 1 atm exists in solid phase (dry ice). • at 1 atm, sublimation is the only way to change from solid to vapour phase • Critical point: • For P > Pcr, no separation into two phases as cooling occurs (only one phase present) • Properties change gradually and continuously without phase transition. • Most ordinary substances, Pcr >> Patm. Therefore, this phenomenon is not observed.
The P-v-T surface • The state of a simple compressible substance is fixed by any two independent intensive properties (once these two are fixed, all the others become dependent properties • f=f(x,y) represents a surface in space can represent P-v-T behaviour of a substance as a surface in space. • v and T independent properties, • P dependent property P=P(v,T) P-v-T surface of a substance that contracts on freezing.
All points on the surface are equilibrium states. • All states along the path of a quasi-equilibrium process lie on the P-v-T surface • Single-phase regions appear as curved surfaces • Two-phase regions appear as surfaces perpendicular to the P-T plane P-v-T surface of a substance that expands on freezing (like water).
abcdef : • constant P heating • Melting along bc • Vapourising along de • Note: volume changes • nopq: • isothermal solidification directly from vapour phase • Process involved in growth of crystals directly from vapour e.g. snowflakes, frost, fabrication of some solid-state electronic devices. • ghjklm: • Isothermal compression • Liquefaction along hj • Solidification along kl • Isothermal compression with increase in pressure : gh and jk
All pure substances exhibit same general behaviour. • However, the triple-points and critical temperatures vary. • Water: Tcr = 374.14oC and at normal conditions, T< Tcr/2 • Most metals: Tcr >> Tcr of water • In considering the behaviour of a subsatance at a given state, it is helpful to think of this state in relation to Tcr or the triple point • e.g. if P>Pcr : not possible to have liquid and vapour in equilibrium • Reading assignment: • Sears and Salinger: pg 30 – 40, or • Zemansky: pg 25 – 33, or • Van Wylen and Sonntag: chapter 3, or • Cengel and Boles: chapter 2
Is water vapour an ideal gas? • Cannot be answered with a simple yes or no. • Can calculate the percentage error involved in assuming steam to be an ideal gas, and then compare with experimentally observed data (available from thermodynamic tables.) Percentage error:
At P<10 kPa, water vapour can be treated as an ideal gas, regardless of temperature, error is <0.1% • At higher P, the % error is large, especially near the critical point and the saturated vapour line (% error can be >100%)
Compressibility Factor • A measure deviation from ideal gas behaviour • Defined as: • or • Can also be expressed as: • for ideal gas : • for real gases: The further away Z deviates from unity (1), the more the gas deviates from ideal-gas behaviour
We usually say that gasses follow the ideal-gas equation closely at low pressures and high temperatures. • BUT: what constitutes low pressure or high temperature? • Question:Is -100oC a low temperature? • Answer:Yes, for most substances. • No, for air (or nitrogen) • At T=-100oC and at 1 atmosphere, air (or nitrogen) can be considered as an ideal gas (error <1%) • Reason: -100oC > Tcr for N2 (or air) [=-147oC], and it is away from the saturation region. • Most substances exist in the solid phase at this temperature. • The pressure or the temperature of a substance is high or low relative to its critical temperature or pressure.
Gases behave differently at a given temperature and pressure. • But have same behaviour at temperatures and pressures normalised to their critical temperatures and pressures. • Normalisation: • Reduced pressure: • Reduced temperature: • At PR and TR, the Z factor is approximately the same for all gases. • principle of corresponding states • Can plot the experimentally determined Z values against PR and TR for several gases • By curve-fitting all the data, can obtain the generalised compressibility chart that can be used for all gases.
T Nonideal-gas behaviour Ideal-gas behaviour Ideal-gas behaviour v • At very low pressures (PR << 1 or P << Pcr), the gases behave as an ideal gas regardless of temperature. • At high temperatures (TR > 2 or T > 2 TR), ideal-gas behaviour can be assumed with good accuracy regardless of pressure (except when PR >> 1). • The deviation of a gas from ideal-gas behaviour is greatest in the vicinity of the critical point.