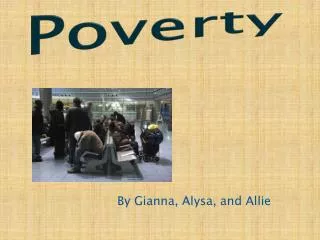
Poverty
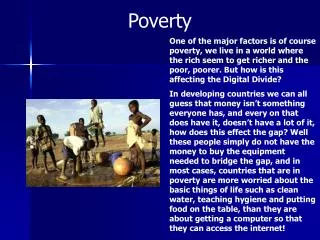
Poverty. In most areas of the U.S., a family of four must have an annual income of $36,000 to afford the basic necessities of life like food and housing. This is double the federal poverty level.

Poverty
E N D
Presentation Transcript
In most areas of the U.S., a family of four must have an annual income of $36,000 to afford the basic necessities of life like food and housing. This is double the federal poverty level. Source: (Low-Income Children in the United States, 2003, National Center for Children in Poverty)
Individual Choice, Responsibility & Free - Will? Social Circumstances Beyond One’s Control?
Losing Ground: American Social Policy, 1950 - 1980 Charles Murray According to Murray, America has a permanent underclass of unproductive citizens who prefer to live on welfare. They are unwilling to make the effort to hold a responsible job and get ahead in life. They remain in poverty by choice. Since their children receive little educational encouragement at home and become mired in a cultural setting that destroys the work ethic, they grow up to be copies of their parents thereby perpetuating the existence of an underclass. Such people do exist - in the millions - 3 to 6 million. They are the toughest challenge for policymakers because almost nothing about their lives equips them to escape from poverty and the circumstances that surround them.
Poverty in the United States But -- recent estimates indicate that the “underclass” make up only 10 to 20 percent of the roughly 36 million - one in eight Americans - who live below the poverty line. According to the U.S. Department of Labor Bureau of Labor Statistics, for the year 2000, 6.4 million people - 20.7 percent of all poor people - were classified as the “working poor”: individuals who spent at least 27 weeks in the labor force (working or looking for work), but whose incomes fell below the official poverty level. The majority of the working poor—three-fifths— were full-time workers [14.8% off all poor people]
Among those in the labor force for 27 weeks or more in 2000, about 6.4 million were classified as the working poor. The working poor thus made up 4.7 percent of all persons who spent at least 27 weeks working or looking for work.
Persons employed in occupations that usually do not require high levels of education and that are characterized by relatively low earnings were more likely to be among the working poor. For example, 10.3 percent of service workers were classified as working poor in 2002. Service occupations, with 2.2 million working poor, accounted for 29.3 percent of all those classified as the working poor.
Poverty in the United States Despite working, these people remain poor because they hold menial, dead-end jobs that have no benefits and pay the minimum wage or below. The federal minimum wage of $5.15 an hour adds up to only $10,712 for full-time work (before taxes). It takes $8.20 an hour for a full-time worker to earn enough money to reach the poverty level for a family of four. The two million Americans working in nursing homes earn, on average, between $7 and $8 an hour. The median wage of the estimated 2.3 million child-care workers is $6.60 an hour, usually without benefits.
Nearly one quarter of all workers – more than 28 million in all -- earn less than $8.78 an hour, the amount needed to lift a family of four above the poverty line with full-time work (about $18,200 a year). (Economic Policy Institute, The State of Working America 2002-03, p. 355)
Which is the bigger cause of poverty today — that people are not doing enough to help themselves out of poverty, or that circumstances beyond their control cause them to be poor? TOTAL DEMOCRAT REPUBLICAN INDEPENDENT People not doing enough48 37 63 48 Circumstances 45 57 31 46 If the government were willing to spend whatever it thought was necessary to eliminate poverty in the United States, do you think that this is something that could be accomplished, or not? Yes47 56 34 47 No49 40 61 50
Which of the following statements comes closer to your own views: Poor people today have it easy because they can get government benefits without doing anything in return, or poor people have hard lives because government benefits don’t go far enough to help them live decently? TOTAL DEMOCRAT REPUBLICAN INDEPENDENT Easy46 38 60 45 Hard43 55 28 45 Do you think that most welfare recipients today really want to work or not? Work47 55 37 48 Not Work44 38 55 41
Michael O. Emerson Professor of Sociology Rice University Christian Smith Professor of Sociology University of North Carolina at Chapel Hill
Explaining Racial Economic Equality: The Interviews (N=117) The large majority – nearly three-quarters -- answered in terms of “lack of motivation” and “cultural” deficiencies (i.e., bad choices, bad relationships) which are seen in terms of individual decisions, not culturally rooted values. “Black Americans lack hope and vision; they lack ability to see what is truly possible.” African Americans – according to many of the respondents – are not true accountable free-will individualists, are relationally dysfunctional, and sin both in relying on programs rather than themselves, and by shifting blame to structurally based reasons for inequality.
Anti-structuralism Since race problems are seen essentially as individually based, such social structural explanations as unequal access to resources, segregation, or institutional discrimination are deemed by many White evangelicals as either irrelevant or simply wrongheaded. Moreover, evangelicals generally believe that sinful individuals typically deny their own personal sin by shifting blame somewhere else, such as on “the system.” Evangelicals are selectively aware of social institutions – they see those that both impact them in their own social location and tend to undermine accountable free-will individualism; ie. affirmative action programs.
Blaming the Victim William Ryan There is a marked tendency in our society for people in fortunate circumstances to “blame” people in less fortunate circumstances for their plight. Rather than focus on broader social factors—factors that are often beyond the immediate control of individuals—that might contribute to ones’ situation, people seek to explain it by referring to some sort of character failing. The poor, for example, are often thought of as defective personalities or deficient moral types. They are people who do not share “our” values; they are not “like” us. Their impoverishment is their own fault. They are “deserving” of their situation and thus “undeserving” of our society’s aid. “If only they worked harder. . . .”
Blaming the Victim William Ryan According to Ryan, blaming the victim involves four simple steps: 1. Pick a social problem. Decide how people who suffer from the problem differ from everyone else. 3. Define these differences as the cause of the problem. 4. Respond to the problem by trying to change the victims, not the larger society.
Blaming the Victim William Ryan Blaming those who find themselves in unfortunate circumstances for their situations serves to reduce others’ psychic discomfort. “Could it happen to me, too?” “Blaming the victim” reinforces the consoling notion – for those in fortunate circumstances – that life is fair. People get what they deserve. Bad things happen to bad people. “That couldn’t happen to me because I am not like them. I’m responsible. I work hard. Bad things happen to bad people”
Blaming the Victim William Ryan How consoling is the converse: Bad things happen to good people. “Even though I work hard and do everything right, I, too—because of circumstances beyond my control—could end up like them?” The fact that the overwhelming majority of the poor are also loving parents, churchgoers, law-abiding citizens, and good neighbors seems immaterial. There is considerable evidence that, when asked about their values, poor people sound as much or more mainstream than most better-off Americans.
Maximum Monthly Benefits TEXAS US (Median) (Family of 3, no income reported) 1996 (AFDC) $ 188$ 415 1998 (TANF) 188421 2000 (TANF) [48% of median] 201421 Monthly Food Stamp Allotment Per Person (2000) $ 75.98$ 72.78 For the year 2000: $75.98 x 3 = $227.94 $72.78x3= $218.34 + $201.00+$421.00 monthly allowance$428.94 $639.34 x 12x 12 yearly payment$5,147.28 $7,672.08 $13,738 37.5% - 55.9%
“Getting Something for Nothing” Yearly Payment TEXAS U.S. Median TANF + FS $5,147.28 $7,672.08 Tax Deduction for interest payments on mortgage 7% mortgage - 30% tax bracket Interest Payment Tax Refund $150,000 $10,602 $ 3,181 $200,000 $14,136 $ 4,241 $250,000 $17,670 $ 5,301 $300,000 $21,204 $ 6,361 $350,000 $24,738 $ 7,421 $400,000 $28,272 $ 8,482 $450,000 $31,806 $ 9,542 $500,000 $35,340 $10,602
Absolving the Rich Demonizing the Poor “Governor Declares Welfare Fraud Program a Major Success” In 1996 New York Gov. Pataki: “finger imaging” to weed out welfare cheats. Roughly 25,000 of cheating were detected – 3.4% of the 747,000 cases • Texas TANF Fraud – 1998 • According to testimony presented to the Senate Committee on Human • Services the Texas Department of Human Services disqualified only 3.2% • of its entire TANF caseload for fraud in FY 1998. • Money involved amounted to 1% of the TANF + Food Stamp program. Much of Food Stamp fraud is perpetrated by retailers. The biggest fraud case in Texas [February 1998 – March 31, 1999] involved six store owners in Houston defrauding the FS program of more than $2 million.
Absolving the Rich Demonizing the Poor According to the latest Roper Poll conducted for the IRS Oversight Board 24% OK to cheat 11% OK to cheat “a little here and there” 5% cheat “as much as possible” According to IRS figures, 17 cents of every dollar owed in federal taxes is never paid IRS Commissioner Charles O. Rossotti testified at Senate Finance Committee Hearings that taxpayer non-compliance – underreporting income and fabrication of deductions –costs the federal government – not including offshore funds. 2000 $250 billion 1998 $195 billion 1996 $170 billion
Texas rates second in the nation for hungry families. It is estimated that 1.1 million children in Texas are hungry or at risk of hunger. This is 32% of all Texas children. Source: Center for Public Priorities 2002 and America’s Second Harvest 2003
Families and Children in Texas In Texas, there are 2,947,658 families, with 5,722,847 children. Low-Income Families: 41% (1,214,809) of families with children are low-income (National: 34%). Families in Poverty: 17% (500,898) of families with children are poor (National: 14%). Low-Income Children: 46% (2,628,237) of children live in low-income families (National: 37%). Children in Poverty: 20% (1,170,325) of children live in poor families (National: 16%).
Many low-income parents in Texas families are employed 63% (771,338) of low-income families include at least one parent who is employed full-time/ year-round. 25% (305,379) of low-income families include only parent(s) who are employed either part-year or part-time. Just 11% (138,093) of low-income families have no employed parents.
In Texas, parents with limited education are more likely to be low-income 36% (433,507) of low-income families are headed by parent(s) who do not have a high school degree. Only 7% (120,689) of all other families are headed by parent(s) who do not have a high school degree.
Low-income families in Texas are more likely to be headed by a single parent 43% (520,969) of low-income families are headed by a single parent. 19% (321,192) of all other families are headed by a single parent.
In Texas, black and Latino children are more likely to live in low-income families 22% of white children live in low-income families. 51% of black children live in low-income families. 66% of Latino children live in low-income families.