What Influences Enzyme Activity?
280 likes | 467 Vues
What Influences Enzyme Activity?. Presented by Deb Semmler St. Joseph’s High School dsemmmler@saintjoehigh.com. Objective of Lab.

What Influences Enzyme Activity?
E N D
Presentation Transcript
What Influences Enzyme Activity? Presented by Deb Semmler St. Joseph’s High School dsemmmler@saintjoehigh.com
Objective of Lab • Students will investigate the activity of the enzyme diastase, and examine the effects of enzyme concentration, temperature, and pH on the ability of diastase to digest starch.
Background • Catalysts help to control the rate of chemical reactions by either speeding them up or slowing them down. • Although they are an important factor in the ability of a chemical reaction to take place, they are unchanged and therefore a small amount of catalyst can be used and reused in a reaction.
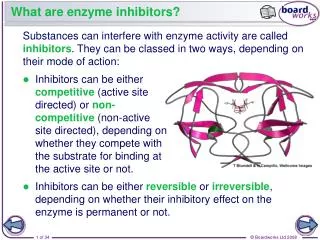
Enzymes • Enzymes are protein molecules that act as catalysts of biological systems. • They are, however, extremely specific and tend to act on only one substrate (the substance altered by an enzyme) changing it to only one product. • This is called the ‘lock and key’ model
Examples of digestive enzymes • lactase – breaks down lactose (milk sugars) • diastase – digests vegetable starch • sucrase – digests complex sugars and starches • maltase – digests disaccharides to monosaccharides (malt sugars) • pepsin – breaks down proteins into peptides • peptidase – breaks down small peptide proteins to amino acids • trypsin – derived from animal pancreas, breaks down proteins • lipase – breaks down fats found in most dairy products, nuts, oils, and meat • cellulase – breaks down cellulose, plant fiber; not found in humans
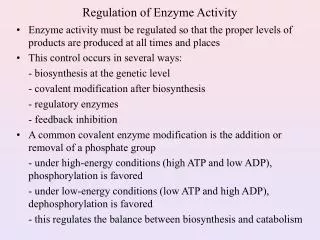
Affecting enzyme performance Concentration of enzyme – how much enzyme is available Temperature and pH -Since the lock and key principle is dependant on the shape of the enzyme molecule and their ability to fit together with the molecule of the substrate, anything that affects that shape affects the rate of reaction. Since enzymes are proteins they are highly dependant on temperature and pH.
Concentration of enzyme – how much enzyme is available - at a constant concentration of enzyme, the reaction rate increases with increasing substrate concentration until all of the available enzyme is joined with substrate. - the reaction rate is maxed out and adding more enzyme or substrate will have no further effect on the rate
Temperature • As the temperature is raised or lowered , the shape of an enzyme is altered slightly. As a result of this change in shape, it can become either more or less effective as it may fit together better or worse with the substrate. • This gives the enzyme a range of temperature where it can effectively facilitate the reaction. • There is also a maximum temperature, above which the enzyme is denatured, or deactiviated.
pH • Like temperature, enzymes are very sensitive to changes in pH. Acidic and basic ions, which occurs in varying concentrations as the pH of a solution changes, react with enzyme molecules. These reactions change the shape of the enzyme much like a change in temperature does, with similar effects on enzyme activity.
Background for the lab we are doing • Starch is a common nutrient used by many organisms, yet it is insoluble, and cannot be effectively absorbed. • It must therefore be broken down to sugars, which are used to produce energy in living systems. • Although this reaction would occur on its own, the time it would take to occur spontaneously is so prohibitive that it is not a possibility for organisms. • Diastase is an enzyme that facilitates this conversion of starch to sugar and will be used in this lab to demonstrate the principles of enzyme activity.
Materials: per group Spot plate Small cups Pipettes Clock w. second hand Shared materials: class Starch indicator solution Starch solution Diastase solution Distilled water Activity 1 – effect of enzyme concentration on reaction rate
Procedure: Activity 1 • Obtain 10 mL of starch solution, 10 mL of diastase solution and 10 mL distilled water and place them into their own small cup. Keep track of which is which and designate a pipette to use for each. • Place one drop of diastase into each well on your spot plate followed by four drops of water into each well.
3. Now the wells are set. Before you go on, be ready with some starch indicator solution in another cup with a pipette and have a timing device handy. 4. The starch indicator solution will show you if any starch is in the well or if the enzyme has broken it down. If starch is still there you will see a blue-black color. Once the starch is broken down, you will see an orange or yellow color. 5. You are going to run this whole experiment 5 times with a different amount of enzyme in each well. This first time only has 1 drop of enzyme in the well. You will all wells again with 2,3,4 and 5 drops of enzyme. 6. So let’s get this one running.
Run the experiment 7. Very quickly put one drop starch into all 12 wells. Just as quickly, add one drop of starch indicator to the first well and note the color. This is your time zero. Start watching the clock. 8. Every 30 seconds, add starch indictor to the next well, note the color and go on, adding starch indicator to each successive well every 30 seconds until you go from a blue-black color to an orange/yellow color. Once you’re achieved the color change you want, stop and count up the number of wells you’ve used to accomplish this. 9. Since each well ‘worked’ for 30 seconds, you can figure out how long it took the one drop of enzyme to change the starch into sugar. Record that time in table #1 for 1 drop of enzyme. Rinse out your spot plate and shake out the water and we will set for the others.
Repeating for 2,3,4,& 5 drops of enzyme 10. Reset you spot plate but this time add 2 drops of enzyme and 3 drops of distilled water. Proceed the way you did in the first experiment. 11. Reset with 3 drops enzyme/2 drops water and run again. 12. Reset and run with 4 drops enzyme/1 drop water. 13. Reset and run with 5 drops enzyme/ no water. Record all results and graph.
Activity 2 – Effect of pH on Diastase Activity Objective : to learn the effect of varying pH on enzyme and particularly diastase activity Materials: use the same materials as activity 1 but share a dilute hydrochloric acid solution, and dilute sodium hydroxide solution
Procedure 1. Place drops of enzyme and 3 drops of water into each of three wells. 2. Add one drop of hydrochloric acid (acid- low pH) into the first well, one drop of water (neutral – middle pH) into the second and one drop of sodium hydroxide (base- high pH) into the third. Now the tray is set to run.
To run experiment: 3. Quickly drop 2 drops of starch solution into each well. 4. After two minutes has passed, add one drop of starch indicator to each of the wells. 5. Observe the color change in each well and record your observation in the table below. Note: the sodium hydroxide has a tendency to bind with the indicator solution and decolorize it. Therefore, a lighter blue color will indicate a positive test for starch in the presence of a base.
Activity 3- effects of Temperature on Enzyme Activity Objective: to learn the effects of varying temperature on enzyme and particularly diastase activity. Materials: same as activity 1 but the enzyme solutions will now be at different temperatures
Procedure 1.This time add two drops of starch solution to each of the four corner wells. 2.Take the spot plate over to the bench and quickly add five drops of enzyme solution to each well from four different sources: ice bath (0-10 degrees C); room temp. (20-25 degree C); body temp. (35-45 degree C); near boiling (90-100 C). Start timing
3. Allow reaction to continue for one minute and add a drop of starch indicator solution to each well. 4. Observe the wells and record you observations in the table below.
Activity 4- Starch digestion Objective: to observe and understand the production of glucose from the digestion of starch Materials: same Glucose test strip
Bayer diastix – for diabetics (find at any local pharmacy- call ahead)
Procedure • Place five drops of distilled water in two wells of your spot plate. • Add two drops of starch solution in each of the two wells. • Add a drop of enzyme solution to only one of the wells. The other well without enzyme added to it will be your control. • After 3 minutes, test for the presence of sugar by dipping the test strips into each well. Wait 10 seconds, then observe and record any color change in Table 4. The indicator changes color in varying degrees, from the initial pink to dark purple in the presence of increasing concentrations of glucose. A color change after ten seconds is indicative of glucose production from the digestion of starch. • After testing for glucose, add one drop of starch indicator to both wells to test for the presence of starch. Record your observations in Table 5.