Market review
Global Credit Update – issued in May 2013 For Professional Investors or Advisors Only. Monthly Newsletter. Schroder ISF # Global Corporate Bond. Market review

Market review
E N D
Presentation Transcript
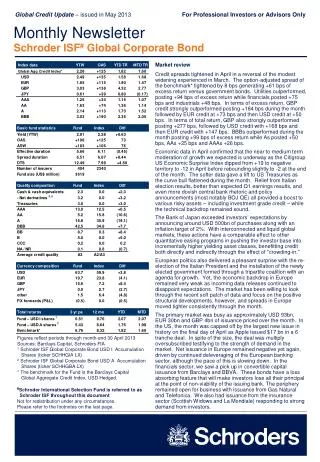
Global Credit Update– issued in May 2013 For Professional Investors or Advisors Only Monthly Newsletter Schroder ISF# Global Corporate Bond Market review Credit spreads tightened in April in a reversal of the modest widening experienced in March. The option-adjusted spread of the benchmark* tightened by 8 bps generating +61 bps of excess return versus government bonds. Utilities outperformed, posting +94 bps of excess return while financials posted +75 bps and industrials +48 bps. In terms of excess return, GBP credit strongly outperformed posting +184 bps during the month followed by EUR credit at +73 bps and then USD credit at +50 bps. In terms of total return, GBP also strongly outperformed posting +277 bps, followed by USD credit with +168 bps and then EUR credit with +147 bps. BBBs outperformed during the month posting +99 bps of excess return while As posted +50 bps, AAs +25 bps and AAAs +26 bps. Economic data in April confirmed that the near to medium term moderation of growth we expected is underway as the Citigroup US Economic Surprise Index dipped from +19 to negative territory to -12 in April before rebounding slightly to -2 at the end of the month. The softer data gave a lift to US Treasuries as the curve bull flattened during the month. Relief from Italian election results, better than expected Q1 earnings results, and even more dovish central bank rhetoric and policy announcements (most notably BOJ QE) all provided a boost to various risky assets – including investment grade credit – while the technical backdrop remained sound. The Bank of Japan exceeded investors’ expectations by announcing around USD 500bn of purchases along with an inflation target of 2%. With interconnected and liquid global markets, these actions have a comparable effect to other quantitative easing programs in pushing the investor base into incrementally higher yielding asset classes, benefitting credit both directly and indirectly through the effect of “crowding-in.” European politics also delivered a pleasant surprise with the re-election of the Italian President and the installation of the newly elected government formed through a tripartite coalition with an agenda for growth. Yet, the economic backdrop in Europe remained very weak as incoming data releases continued to disappoint expectations. The market has been willing to look through the recent soft patch of data and focus on the positive structural developments, however, and spreads in Europe moved tighter consistently through the month. The primary market was busy as approximately USD 93bn, EUR 30bn and GBP 4bn of issuance priced over the month. In the US, the month was capped off by the largest new issue in history on the final day of April as Apple issued $17 bn in a 6 tranche deal. In spite of the size, the deal was multiply oversubscribed testifying to the strength of demand in the market. Net issuance in Europe remained negative yet again, driven by continued deleveraging of the European banking sector, although the pace of this is slowing down. In the financials sector, we saw a pick up in convertible capital issuance from Barclays and BBVA. These bonds have a loss absorbing feature that will make investors lose all their principal at the point of non-viability of the issuing bank. The periphery remained open for business with issuance from Gas Natural and Telefonica. We also had issuance from the insurance sector (Scottish Widows and La Mondiale) responding to strong demand from investors. Figures reflect periods through month-end 30 April 2013 Sources: Barclays Capital, Schroders FIA 1 Schroder ISF Global Corporate Bond USD I Accumulation Shares (ticker SCHHGIA LX) 2 Schroder ISF Global Corporate Bond USD A Accumulation Shares (ticker SCHHGBA LX) * The benchmark for the Fund is the Barclays Capital Global Aggregate Credit Index, USD Hedged. #Schroder International Selection Fund is referred to as Schroder ISF throughout this document Not for redistribution under any circumstances. Please refer to the footnotes on the last page.
Global Credit Update– issued in May 2013, page 2For Professional Investors or Advisors Only Monthly Newsletter Schroder ISF Global Corporate Bond Portfolio positioning (continued) We decreased the Fund’s credit spread beta to an overweight of +4.50 in duration-times-spread (DTS) by the end of April from +5.23 to end March. This decline of 0.73 compares with a decline of 0.09 for the benchmark as spreads tightened. We reduced exposure in high yield emerging markets (via Petroleos de Venezuela and MHP SA); in consumer non-cyclicals across several credits (including BMW, Imperial Tobacco, Hawk Acquisition); in communications (via CBS Corp and AT&T); and in banking (including Nationwide Building Society and BNP Paribas). The largest increase to risk exposure came from our reduction in our tactical short risk position in the iTraxx Main index and initiation of a long risk position in iTraxx Senior Financials. We continue to find value and add risk for the Fund in the new issue market. Key additions in April included Apple, Altria, Home Depot, Ford Motor Credit and Unicredit SPA. The Fund’s largest industry overweights are in insurance, communications, banking, transportation, capital goods, consumer cyclicals and electric utilities. The largest underweights are to sovereigns, natural gas, technology, brokerage and supranationals. The Fund remains underweight EUR-denominated credit in favor of the UK and North American markets, and we continue to add emerging markets exposure via new issues. Figures reflect periods through month-end 30 April 2013 Sources: Barclays Capital, Schroders Please refer to the footnotes on the last page. Portfolio positioning Performance was ahead of the benchmark in April. The Treasury curve strongly bull flattened during the month while riskier assets also rallied resulting in strong total returns in April (a +1.60% total return for the benchmark). Security selection within corporate sectors was the primary driver of returns during the month. In particular, security selection in insurance and banking was the chief contributor as they bounced back strongly from underperforming the prior month as a result of events in Cyprus. Also contributing to performance was security selection in communications, consumer cyclicals and electric utilities. The Fund’s exposure to covered bonds and cash modestly detracted from the portfolio’s relative returns, as did the Fund’s short risk position in the iTraxx Main index. On a regional basis, the Fund’s overweight in North America and Europe contributed to returns while underweightings to South America and Asia detracted modestly. Our overweighting of BBBs and the Fund’s high yield exposure contributed strongly to performance as lower quality credit outperformed in April.
Global Credit Update– issued in May 2013, page 3 For Professional Investors or Advisors Only Monthly Newsletter Schroder ISF Global Corporate Bond Market outlook For each of the past three years the old adage of “sell in May and go away” has proved prescient with spreads widening during May in each year as a blend of weaker economic data and volatility in Europe have conspired to derail strong returns posted during the first quarter. Given the historic low level of yields, strong excess returns generated over the last 18 months and recent softer economic data, there is an understandable impulse to reduce risk ahead of this seasonally weak period for risk markets. While we certainly would not rule out a transient period of consolidation following strong performance, we believe for several reasons that the underlying pillars of the market remain sound and that credit spreads will be tighter yet in coming months. First, financial markets currently remain in a period characterized by extraordinary accommodation by global central banks. The Fed continues to purchase $85 billion of MBS and Treasury securities per month. The result is that net issuance across US fixed income markets is likely to be negative this year. Added to this is the unexpectedly aggressive action taken by the BoJ, announced in early April, to double the monetary base to 55% of GDP and significantly broaden the list of securities eligible for asset purchases. The combined effect of these measures is very powerful in pushing investors into yield and “crowding in” credit spreads as a result. The surge in demand for high grade credit is revealed in the weekly mutual fund flow data, which is consistently positive, and the strong demand for new issues. Second, the fundamental backdrop of the market broadly remains sound for creditors. In aggregate, leverage has continued to tick up for each of the past several quarters, yet interest coverage remains stable as companies have rushed to seize record low coupons. We continue to expect increasing shareholder friendly activities across the market; however, we believe that navigating this risk is best achieved through careful issuer analysis and security selection, by concentrating holdings in issuers that are poised to deleverage and where relative value is more compelling. This is the prime reason for our overweighting of lower-rated credit at the expense of higher quality, tight trading corporates. Finally, while equity markets have surged year to date, credit spread tightening has been relatively subdued in comparison. The benchmark OAS has tightened by 7 bps so far in 2013. We continue to believe that further spread compression will be realized in the pockets of the market where we have taken exposure in the Fund. As a percentage of yield and relative to other high quality fixed income asset classes, credit continues to offer attractive relative value. Given the above considerations, we continue to reflect a constructive bias in the portfolio and we remain focused on bottom-up issuer-level analysis to construct the portfolio. We are acutely aware of transaction costs, which have increased as a percentage of overall spreads as spreads have tightened, so we are inclined to take a medium to long-term view in our cash credit holdings while reflecting shorter term tactical views in the more liquid CDS and CDS index markets. Figures reflect periods through month-end 30 April 2013 Sources: Barclays Capital, Schroders FIA Note: Table data reflect those sectors that the Fund is overweight versus the benchmark on a DTS basis, as well those sectors that the Fund is underweight, sorted by active DTS risk. Sector breakdown tables above include only those sectors with active risk by DTS of more than +0.02 overweight or -0.02 underweight versus the benchmark,* and not all sectors are listed here. * The benchmark for the Fund is the Barclays Capital Global Aggregate Credit Index, USD Hedged. Not for redistribution under any circumstances. Please refer to the footnotes on the last page. The Fund portfolio management team: Wes Sparks • Sarang Kulkarni • Lucette Yvernault • Gregg Moore • Ryan Mostafa • Chris Tackney
Global Credit Update– issued in May 2013, page 4 For Professional Investors or Advisors Only Monthly Newsletter Schroder ISF Global Corporate Bond *The benchmark for the Fund is the Barclays Capital Global Aggregate Credit Index, USD Hedged. Prior to November 2008, the benchmark was branded under Lehman Brothers; in November 2008, all Lehman Brothers fixed income indices were rebranded under the name of the Barclays Capital Indices. Schroder International Selection Fund is referred to as Schroder ISF. 1 Fund data reflects the Schroder ISF Global Corporate Bond I Class USD Accumulation Shares (ticker SCHHGIA LX). 2 Returns are also provided for the A Class USD Accumulation Shares (ticker SCHHGAA LX). Other shares classes of the Fund are available, and total returns for those share classes are available upon request. The source for all fixed income index data is Barclays Capital. The source for the total returns for Schroder ISF Global Corporate Bond is from the NAV pricing of the Fund (as calculated by JPM Luxembourg and as published on Bloomberg). The source for all other Fund data is Schroders Fixed Income Analytics. Please note that there can be a slight difference between the portfolio composition break-down and other fund statistics reported in this publication when compared to other final month-end fund publications – this is due to the one-day time lag between trades executed on the trading desk and reported by the Fund’s accounting book of record versus the positions reported by the Fund’s custodian domiciled in Luxembourg. (For example, if we trade on the last day of the month, statistics in this publication will be impacted whereas the reports generated by the custodian will not reflect such trading activity for month-end reports.) Also, please note that there is a timing difference between daily pricing of the NAV of the Fund in Luxembourg and the pricing of the index in the afternoon in New York; when there is material intra-day market volatility, this can have a meaningful impact on the return of the Fund compared to the index over a very short horizon. The quality composition classification of bonds by rating in the table on the first page of this publication is based on the methodology of the average of the ratings by Moody's, S&P, and Fitch; whereas, the month-end Factsheet and other similar publications base ratings classifications on the higher rating of the three rating agencies. For example, a bond rated Baa1/BBB+/A- by Moody's, S&P, and Fitch, respectively, would be included in the triple-B quality tier in this Global Credit Update publication, whereas the Fund Factsheet would treat it a single-A. In both sets of publications, the quality tier classification is consistent in treatment for both the Fund and the benchmark. “NA / NR” refers to bonds with ratings not available or bonds not rated. 3 Please note that a line item is displayed in the quality composition table that shows the net CDS exposure as an offset against cash, so that we can show the effect of individual CDS positions on the credit quality classifications. For example, if the Fund held a 4% net long risk position in single-name CDS, then a -4% offset would be shown against the cash position, so that the percentage notional CDS held can be classified under each respective ratings category for each CDS position; if a net short-risk position is held in CDS, this line would have a positive number. Please note that fund exposure to the CDS indices (CDX HY and iTraxx XO) are reflected in “Other Industrial” in the sector breakdown table on page 2. 4 Similarly as in footnote 3, a net derivatives exposure line item is shown at the bottom of the sector breakdown table on page 2 so that we can split out the effect of government bond futures and show the impact of such hedging activity on the portfolio in terms of overall CTD, CTSD, and DTS, as well as to show the aggregate net exposure in CDS so that individual CDS positions can be included in the respective sector breakdown classifications in the table. A positive number on this line reflects net short positions in derivatives (in aggregate for both interest rate futures and CDS). Glossary of terms used in this document "TR" = total return; “XR” = excess return (versus matched-duration US Treasuries); “YTD” = year-to-date; “MTD” = month-to-date; “pa” = per annum; “CDS” are credit default swaps. Yield-to-worst (YTW), is similar to the yield-to-maturity (YTM) for a bond, but is a more appropriate statistic for callable bonds (where the issuer holds the option to call the bond at a date earlier than the final maturity, based on the bond's specific call schedule). Option-adjusted-spread (OAS) is the spread of a corporate bond relative to risk-free government bonds (US Treasuries), incorporating the value of any embedded call options in the corporate bond using a bond options pricing model. The OAS for the index or for the fund is just the weighted average OAS of the individual bonds comprised therein. OAS is expressed in basis points (hundredths of a percentage point). Asset swap spread (ASW) is the difference between a bond’s coupon cash flow and an offsetting swap’s fixed coupon in basis points. Effective duration is the approximate percentage change in price for a given bond or portfolio associated with a 100 basis point change in interest rates, incorporating the impact of any embedded options on the bond’s valuation. “Active” exposures in the tables on page 2 and page 3 reflect the difference between the Fund and the benchmark in each respective sector for several different measures of bond risk (CTD, CTSD, and DTS). CTD is contribution-to-duration, reflecting each sector’s respective contribution to the overall effective duration of the portfolio, based on the market value percentage exposure in each sector multiplied by the average effective duration of that sector. CTSD is contribution-to-spread-duration, reflecting each sector’s respective contribution to the total spread duration of the portfolio. Spread duration is the price sensitivity of a bond or portfolio to a 100 basis point change in its OAS. DTS is duration-times-spread, calculated by the product of the market weight, spread duration, and spread of a given bond or sector. The behaviour of spreads results in excess return volatility being proportional to duration-times-spread, and so DTS is now widely regarded as the best risk measure for investment grade credit portfolios, rather than either market value exposure or contribution-to-duration alone. Risk Warnings: Investments in debt securities are primarily subject to interest rate, credit and default risks and, potentially, to currency exchange rate risk. This fund may use financial derivative instruments as a part of the investment process. This may increase the fund’s price volatility by amplifying market events. Important Information: This document does not constitute an offer to anyone, or a solicitation by anyone, to subscribe for shares of Schroder International Selection Fund (the “Company”). Nothing in this document should be construed as advice and is therefore not a recommendation to buy or sell shares. Not for redistribution under any circumstances. The Schroder ISF range is not available to US investors. Subscriptions for shares of the Company can only be made on the basis of its latest prospectus together with the latest audited annual report (and subsequent unaudited semi-annual report, if published), copies of which can be obtained, free of charge, from Schroder Investment Management (Luxembourg) S.A. An investment in the Company entails risks, which are fully described in the prospectus. Past performance is not a reliable indicator of future results, prices of shares and the income from them may fall as well as rise. The views and opinions contained herein are those of the 5-person portfolio management team of Schroder ISF Global Corporate Bond, and may not necessarily represent views expressed or reflected in other Schroders communications, strategies or funds. This document is issued by Schroder Investment Management Limited, 31, Gresham Street, EC2V 7QA, who is authorised and regulated by the Financial Services Authority. For your security, all telephone calls are recorded.