Download

1 / 64
640 likes | 793 Vues
Economic Burden of Diabetes Building Perspective for the Corporates Industrialists. Sanjeev Kelkar Conjoint Faculty The University of Newcastle Australia. Congratulations to Dr Kayathri! Proud of a Colleague. Setting new rules for the old game Empathy, Empowerment, Education

E N D
Economic Burden of DiabetesBuilding Perspective for the Corporates Industrialists Sanjeev Kelkar Conjoint Faculty The University of Newcastle Australia
Congratulations to Dr Kayathri!Proud of a Colleague Setting new rules for the old game Empathy, Empowerment, Education Demystification, Helping patient take chargeof his illness, putting him in driver’s seat to make decisions, support, take him as a partner in coping with diabetes
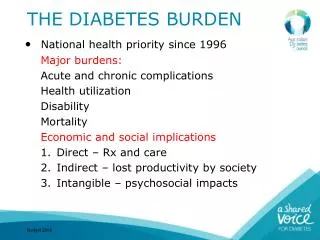
Compared to Normal Population --- A person with diabetes carries 17 times more risk for blindness, more than 50% of all those who are on dialysis, in ICUs, getting amputated in leg are due to diabetes carry a 4 times higher prevalence of hypertension
Congratulations to Dr Kayathri!Proud of a Colleague Diabetes takes all this and more, that is why and where the challenge lies, Each one is affected, each has to contribute, come together to contain the menace and the epidemic
And there are huge costs Costs X numbers X number of complications make staggering numbers Let us have a look at it.
Economic Burden of Diabetes in India Grateful Thanks to Anil Kapur Vice Chairman World Diabetes Foundation Copenhagen, Denmark
Chennai Bangalore Hyderabad Chennai Chennai Kudremukh Ramachandran A et al
Total 11, 216 M : F 5288:5928 Prevalence % IGT DM N Crude Age-std n Crude Age-std Total 1631 14.4 14.0 1684 13.9 12.1 Men 776 14.6 14.0 813 13.8 12.5 Women 855 14.3 14.1 871 14.0 11.9 NUDS Six CitiesNational Urban Diabetes Survey National Urban Diabetes Survey Diabetologia 44: 1094-1101;2001
India 35 31.1 30 27.7 27.2 25 % 20.2 20 DM 17.9 Global 16.6 IGT 15.5 15 14.8 14.3 11.6 10 7.6 5 2.3 0 20 - 29 30 - 39 40 - 49 50 - 59 60 - 69 >69 Age groups (years) NUDS Age Specific Prevalence National Urban Diabetes Survey Diabetologia 44: 1094-1101;2001 Wild et al Diabetes Care 2004; 27:1047-53.
Family History Risk of Diabetes 20 % 40 % 70 % - F/H/O Diabetes - One parent diabetic - One parent diabetic and other from a diabetic family Diabetes Mellitus- Genetics • Family history significant predictor of Diabetes V Mohan & KGMM Alberti International Textbook of Diabetes Mellitus,1992,178.
Current Age Distribution 50 25 0 <15 15-30 30-45 45-55 55-70 >70 DiabCare Asia India Demographics Age Groups Mean Age at Onset of Diabetes 43.6 ± 12.2 (n= 2251) Mean Diabetes Duration 10.0 ± 6.9 (n= 2251)
60% 64% 35% 29% 32% 12% 19% 5% 4% 4% 2% 2% 2% >10y 5-10y <5y n=901 n=626 n=480 Foot Eye MI Stroke ESRD DiabCare Asia India Diabetes Complications In Relation To Diabetes Duration
16 12 8 % of Total 4 0 25-35 36-45 46-55 56-65 Age Group % of Total Population with Diabetes % of Total Charges Attributable to Diabetes Persons with Diabetes Use Higher Health Care Resources Rendell et al Arch Intern Med 1993
CODE 2: Effect of complications on per patient costs 3.5 X 2.0 X 1.7 X None Microvascular Macrovascular Both Lucioni C et al. PharmacoEconomics- Italian Research Articles, 2000 2(1):1-21
CODI Study Mean Expenditure Per Hospitalization (INR)
Quality and Complexity of Care, Costs for People Who Are Ill DIABETES IS RISING HIGH AND RIDING HIGH ON COMPLICATIONS
Why diabetes? • Diabetes is the central paradigm of non communicable diseases just as • Tuberculosis is the central paradigm of communicable diseases • If we improve quality of health care for both a large improvement in related health areas will occur
Why diabetes? • Diabetes control has inescapably got tied with control of cholesterol and fats, Blood Pressure and coronary heart disease, • Offers protection to retina, kidney and foot, lessens thereby the burden of cerebrovascular disease • Tuberculosis cannot be dealt with without important structure – function changes in the health care delivery system
Why Costs Go High? • Delayed diagnosis – 5 to 7 years • Up to 50% having some tissue damage at diagnosis – UKPDS • Team approach lacking, slack controls, • Graduate and post graduate curriculum inadequate in content and time • Multiple disciplines of medicine converge on diabetes
Why Costs Go High? • Health Care Delivery Structure vis a vis capability to deal with non communicable diseases, requires a different mind set • Spiral of upward pressure builds from the level of maximum number and limited quality at periphery • Strong referral channels between primary, secondary and tertiary care could mitigate the problem • Second level capabilities addressing 95% of illness at provincial level satisfactorily – the most crucial link is missing
Cost Effective High Quality Solutions • Common sense, common place restructuring / orientation of public health care delivery • Intelligent, non demotivating regulation of private sector, particularly on quality assurance and wastes of huge money
Issues in SL Evolving new roles • between the central and the peripheral areas during the transition period • between the private and the public sectors. These transitions result may cause • sub optimal utilization of funds, • affecting the internal distribution of resources, also foreign donations.
Issues in SL • For example, foreign donors eager to upgrade the rural health care delivery system have provided expensive equipment to rural hospitals • Operational systems do not improve • Functional efficiency does not improve
Glaring issues in SL • Mismatch on expertise in the rural areas for maintaining or running this equipment, it remains unused. • Prevalence of pertinent disorders vis a vis the capacity and standing expense of these equipment in rural areas
Glaring issues • Supply driven health care offers – mismatch between the real need and suitable measures answering them • A number of large health care projects, some of which are in the planning process, create waste which,
Socio Economic Factors • Lack of awareness in patients & doctors • Population in rural area – Law of inverse care applies 1. quality and poverty, 2. distance from the first competent care level, time to reach it in time • SL has a good track record at primary care level, could be strengthened
Costs of Managing Diabetes • Regular monitoring of diabetes and its complications • Drugs, hospitalizations, surgeries, • Foot problems – dressings, vascular surgery, rehabilitation after foot salvage surgery, loss of income, change in the job/employment
Costs - rising in future • In next 20 years costs of treatment will escalate; a rising affluent class may foot it out of pocket but • the majority will find it more and more difficult to meet it o o p • mechanism to meet costs has to be developed, one way is insurance • has benefits, may make adequate social impact in preventing debilitating complications
Currently available financial supports for diabetes • Self expenditure • Insurance • Charity • Public Sector Healthcare • Employer reimbursement
Two Thirds of Healthcare Spending is out of Pocket, PHC : Public Clinic /Primary Health Care Centres OP : Other Private – includes both qualified and others PC/NC : private Clinic / nursing home PP : Private Practitioner Source: CII –McKinsey & Company, Healthcare In India: The Road Ahead, CII and McKinsey & Company, New Delhi, 2002, p. 38.
Social Health Insurance WHO Study Group on "Evaluation of Recent Changes in Financing of Health Services concluded that "There are no private health insurance markets at all. When they do exist, they are guilty of "Cream Skimming".
Social Health Insurance • The insurer excludes the very people most in need of protection - the poor, the elderly and the unhealthy". • Private health insurance is, therefore, not a viable option for healthcare financing in Sri Lanka.
Social Health Insurance – Model • Prepayment or contribution. Payment is made regularly irrespective of whether services are used or not; • Pooling of funds; • Cross-subsidizing; • Sharing of risks.
Social Health Insurance – Model • Most beneficial – universal contributions made statutory. • A financial source separate from general tax revenue, • Services supplied utilizing the existing infrastructure • Sufficient control vested in the ministry of health to safeguard the poor and to control cost escalation. ROHAN JAYASURIYA, Department of Public Health and Nutrition,University of Wollongong Australia
Health Insurance / Schemes in IndiaBeneficiaries (in Million) • State Insurance Scheme (ESIS) 25.3 • Health Insurance (private sector non-life companies) 0.8 • Health Segment of Life Insurance Companies (public and private) 0.23 • State Sponsored Schemes<0.50 • Mining and Plantations (public sector) 4.0 • Health Insurance (public sector non-life companies) 10.0
Health Insurance / Schemes in IndiaBeneficiaries (in Million) • Central Government 4.3 • Railways 8.0 • Defence Employees 6.6 • Ex-servicemen 7.5 • Employers run facilities/reimbursement private sector 6.0 • Employers run facilities/reimbursement public sector<8.0 • Community Health Scheme 3.0 • Total 85.0
Proposed Financial Supports • National Rural Health Mission – the Community Health Center based model • Talks of public private partnerships, of user fees • Under automatic criticism of left wing
Health Insurance – Schemes Proposed • Community based insurance schemes Definable geographic locations • Trade Based insurance, eg weavers, • Toying with Universal Health Insurance – part subsidy by the central government
Health Insurance – Schemes Proposed • Third Party Administered schemes – defined protocols, expense limits for indoor care, provider beneficiaries connected, cashless at the point of service, • Severs payment service connections, TPA decides on the exactitude of management • Mixed opinions on workability
Health Insurance • Limited Coverage, operative in only the organized sector of economy • The concern is the unorganized sector in a still dominantly agro based economy in SL • Majority Schemes do not cover preexisting diabetes, • Major Private health Insurance companies not active players
Health Insurance • Quality of services • Purposes for which used - leave, getting prescribed • Final run off still to privateers • Overall sub-optimality with islands of excellences
Create Public-Private Partnership. Source: CII –McKinsey & Company, Healthcare In India: The Road Ahead, CII and McKinsey & Company, New Delhi, 2002, p. 183.
Components of current available financial supports • Charity – potentially a non self fuelling way of solving health care issues • External funds, loans etc
Prevention is the keyScientific evidence of studies in cost benefits of prevention
Costs & Benefits • Potential economic benefits of lower-extremity amputation prevention strategies in diabetes.Ollendorf DA, Kotsanos JG, Wishner WJ, Friedman M, Cooper T, Bittoni M, Oster G.Policy Analysis Incorporated, Brookline, Massachusetts, USA. • The total potential economic benefits (discounted at 5%) of strategies to reduce amputation risk ranged from $2,900 to $4,442 per person with a history of foot ulcer over 3 years. • Benefits were highest for educational interventions. • Most benefits were found to accrue among individuals aged > or = 70 years.
Cost benefit in prevention • Team approach toward lower extremity amputation prevention in diabetes • RG Frykberg Harvard Medical School, Beth Israel Deaconess Medical Center, Boston, MA, USA. Cost of prevention are more likely to prevent higher costs of treatment among veterans.
Cost benefit in prevention • Primary Prevention – Nice to talk about, fashionable, unattainable, • Establish a Gym for your employees and measure the utilization • Industry may become a part of a nationwide campaign? • Well tested models available, electronic media underutilized