Download
1 / 68
680 likes | 820 Vues
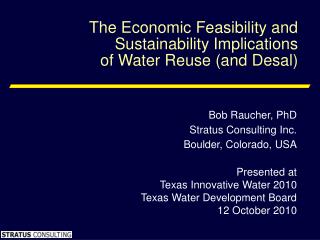
This presentation at the Desalination Conference, co-sponsored by the Aquarium of the Pacific and Desal Response Group, discusses the critical freshwater challenges faced by Southern California. Topics include the current portfolio of water sources, projected freshwater needs for 2030, goals for a diversified water supply, and the uncertainties surrounding ocean desalination as a viable option. Key considerations are examined regarding the sustainability, affordability, and environmental impact of desalination compared to traditional water sources, ensuring a balanced approach to future water supply in the region.

E N D
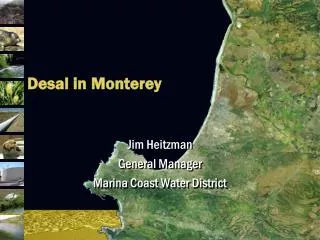
Desal Conference Co-Sponsored By The Aquarium of the Pacific And Desal Response Group October 5, 2006 J. R. Schubel
Topics I Will Touch On • The present portfolio of freshwater sources for S. California • Freshwater “needs” in 2030 • Possible goals for the portfolio • Achieving a mix of sources to achieve portfolio goals in 2030 • The most important and uncertain elements in determining the role of ocean desal in 2030
Metropolitan Water District Service Area
I Will Focus On The MWD • Service area accounts for >92% of S. CA. Population • Supplies > 90% of total URBAN water; 7% of total AG water; and 47% of TOTAL water used in S. California.
S&T Cons. CRA Storage& Trans. Cons. Local SWP CRA Local SWP Southern California’s Water PortfolioYesterday & Today Early 1990’s Heavy dependence on Imported supply In a drought Today Less than half of the region’s Water is imported in dry years Source: Metropolitan Water District
Local Sources N. California Colorado R Reclamation Ocean DeSal • Portfolio Goals • An Stable Supply “Adequate To Meet “Need” • An “Affordable” Supply • A Supply of High Quality Water • A Supply With Enough Redundancy/Elasticity • To Reduce Risk To Acceptable Levels • A “Green” Portfolio of Sources
S&T Cons. CRA Storage& Trans. Cons. Local Storage& Trans. Cons. SWP CRA Local CRA SWP Local SWP Tomorrow 2030 Maintaining the balance for future droughts Southern California’s Water PortfolioYesterday, Today, Tomorrow Early 1990’s Heavy dependence on Imported supply In a drought Today Less than half of the region’s Water is imported in dry years Source: Metropolitan Water District
Moving Around SWP 4100-4500 w/o generation 2600-3200 w/generation CRA 2,000 Ocean DeSal 3260 - 4900* *Ocean Waters = 4,000 and up. Energy Requirements of Moving Water Around vs. Ocean Desalination (kWh/Acre Foot)
Ocean DeSal Entrainment & Entrapment Effects of High Salinity Discharge Enriched in Contaminants Energy-Related Effects…Greenhouse Gases Diversion Entrainment & Entrapment Loss of Estuarine Habitat, Including Tidal Wetlands--Both Fresh & Salt Water Environmental Effects Of Ocean DeSal vs. Diversion From San Francisco Bay And Sea of Cortez
Increase in salinity Compression of low salinity habitat Blocking of passageways of anadromous and semi-anadromous fishes Decline of pelagic organisms…loss, or endangered status, of many native CA spp., e.g. delta smelt Large hypoxic/anoxic zone in Stockton Ship Channel HAB of Microcystis in Delta causing death of fish and plankton Diversion Has Serious Consequences for the Bay
Effects of Diversions on the Sea of Cortez • Increased salinities. • Compression of low salinity areas. • Collapse of toatoaba fishery in 1970. • Collapse of shrimp fishery in late 1980s and early 1900s when catches fell by more than 50%. • Exacerbated water quality problems. • Loss of extensive wetlands and coastal jungle.
0‰ 0‰ Desal 33‰ 33‰ 66‰ >35‰
Putting Environmental Effects of Diversion & Desalination In Perspective SHARING WITH NATURE A. Our Responsibilities For Other Life Forms B. Ecosystem Services (1997) (1) ∑ $33 trillion • 64% contributed by marine systems: • 50% of that coastal. Most valuable--estuaries and wetlands (2) ∑ GDPs = $18 trillion (1997)
Putting The Environmental Effects of Desalination In Perspective SHARING WITH NATURE A. Our Responsibilities For Other Life Forms B. Ecosystem Services (1997) (1) ∑ $33 trillion • 64% contributed by marine systems: • 50% of that coastal. Most valuable--estuaries and wetlands (2) ∑ GDPs = $18 trillion (1997)
Science in Decision-Making Action AoP/SoCal Alternative Water Futures Forum! TACIT AREA Wisdom Value to Decision-Makers Knowledge Information Data Objective Subjective Noise Signal Calculation Judgment
Goals Of The Conference • To Take A Fresh New, Unfettered Look At OCEAN DeSal. • To Provide You With The Information Needed To Put OCEAN DeSal Into Context As A Potential Source of Freshwater For S. California in 2030.
0‰ 0‰ Desal 33‰ 33‰ 66‰ >35‰
"Why is it that stupid things seem so smart when we are doing them." - Dennis the Menace
Conserve as much as possible. Reclaim and recycle as much as possible. In filling the gap: Include nature in the allocation process. Indeed, start with nature. Identify and assess the impacts of exploiting alternative sources. Sources Surface waters Ground waters Ocean waters /Reclaimed waters through desalination Some Guiding Principles
Impacts Associated with Exploiting Different Sources Environmental Economic Other Social Impacts Some Guiding Principles
Increase in salinity Compression of low salinity habitat Blocking of passageways of anadromous and semi-anadromous fishes Diversion Has Serious Consequences for the Bay
Map of Colorado Delta, from journal of Godfrey Sykes in first comprehensive survey.
The Hydrosphere Water SourceVol. in cubic Km% of Total WaterOceans 1,350,000,000 97.24Icecaps, Glaciers 29,000,000 2.14Groundwater 9,500,000 0.61Freshwater Lakes 125,000 0.009Inland Seas 104,000 0.008Soil Moisture 67,000 0.005Atmosphere 13,000 0.001Rivers 1,300 0.0001Total Water Volume 1,388,810 100%
Proposed volume of fresh water to be created from desalination of S. California ocean waters is about 1/17th the amount of fresh water now diverted from Colorado River Delta. • 260,000 Acre Feet/yr Vs. 4.4 Million Acre Feet/yr