Download
1 / 16
160 likes | 280 Vues
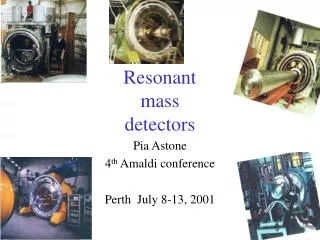
Detector characterization for burst searches by resonant detectors. F. Salemi Italy, INFN and University of Ferrara for the IGEC2 Collaboration The 10th Gravitational Wave Data Analysis Workshop (GWDAW-10) December 14 th to 17 th , 2005 Brownsville, Texas. Outline. AURIGA Spectrum

E N D
Detector characterization for burst searches by resonant detectors F. Salemi Italy, INFN and University of Ferrara for the IGEC2 Collaboration The 10th Gravitational Wave Data Analysis Workshop (GWDAW-10) December 14th to 17th, 2005 Brownsville, Texas.
Outline • AURIGA • Spectrum • Vetoes • Event Search • MonteCarlo Software Injections • Raw Data exchange: • First step toward the Cross-validation of analyses • Results produced by AURIGA Data Analysis • IGEC2 Shh • Event Search • MonteCarlo: Time of arrival uncertainties estimation • Hardware Injections GWDAW10 - December 14th, 2005 - Brownsville, Texas
AURIGA output: the modes Typical recent spectrum averaged on 8 consecutive hours Main modes = mixing of bar, transducer and electrical modes: 865, 914, 955 Hz at thermal noise level GWDAW10 - December 14th, 2005 - Brownsville, Texas
Vetoes (1) GWDAW10 - December 14th, 2005 - Brownsville, Texas
Vetoes Epoch vetoes X Vetoing System Anticoincidence vetoes X Anticoincidence veto: “WideBands” veto Epoch Veto: “F7” veto • 700 800 900 1000 1100 1200 • [ Hz ] GWDAW10 - December 14th, 2005 - Brownsville, Texas
Candidate Events: run687 (July 2005) SNR [ days ] SNR TObs N Events Rate[Hz] 271.3 hr (11.3 days) 64010 66 mHz “Wide band” veto 11829 12 mHz (2087 s vetoed out) “F7” veto 11765 12 mHz (896 s vetoed out) GWDAW10 - December 14th, 2005 - Brownsville, Texas
MonteCarlo results • Measurement of detection efficiency by injections of software signals in real data • crucial to cross-validate detectors in a network Detection efficiency For signals arrival time estimation for signals • Submillisecond arrival time resolution • crucial to check travel speed of the gw and to locate the source GWDAW10 - December 14th, 2005 - Brownsville, Texas
IGEC2 Raw Data Exchange All Credits to Gabriele Vedovato ALLEGRO • Lockin with reference frequency @ 904 Hz • Quadrature & Phase components sampled @ 250 Hz • 2 Binary files (1 day size) • A day of data-taking: AL05262.raw (19 September, 2005) • A day with Hardware Injections: AL05202.raw (22 July, 2005) NAUTILUS and EXPLORER • Binary files: raw data sampled @ 5 kHz • A day of data-taking for both detectors: 11 December, 2004 AURIGA analizing raw data from other bar detectors. The Followed Procedure: • (Upconversion to the original frequency, for ALLEGRO Data only) • Conversion to FRAME Format • Ad-hoc Calibration to comply with validated Shh curves • Analysis with AURIGA Data Analysis (ADA) Scope • Cross-validation • Comparison of different algorithms and pipelines GWDAW10 - December 14th, 2005 - Brownsville, Texas
IGEC2 Shh (obtained by ADA) ALLEGRO: September 2005 AURIGA :July 2005 EXPLORER: December 2004 NAUTILUS: December 2004 GWDAW10 - December 14th, 2005 - Brownsville, Texas
Event Search on all the bars N Evt=3146 N Evt=2859 ETG: δ-matched filter TH: SNR>4.0 N Evt=4650 N Evt=1698 GWDAW10 - December 14th, 2005 - Brownsville, Texas
Sofware Injections: Time errors ALLEGRO: September 2005 AURIGA :July 2005 EXPLORER: December 2004 NAUTILUS: December 2004 Terr [ s ] SNR GWDAW10 - December 14th, 2005 - Brownsville, Texas
ALLEGRO Hardware Injections(22 July 2005) Time-Frequency : hw injected events at 0.02 Hz 840 860 880 900 920 940 960 Spectrum : noise [red] – signal [yellow] GWDAW10 - December 14th, 2005 - Brownsville, Texas
Hardware Injections (2) hw injected : error time distribution (time differences out-in times) hw injected : snr distribution hw injected : phase error time distribution Tphs = 1/(w* snr) = 1 / (6.28 * 910 * 31.12) GWDAW10 - December 14th, 2005 - Brownsville, Texas
Hardware InjectionsAL05202.raw (22 July 2005) The "837 oscillator" is set for brst count = 1 freq = 899 Hz ampl = 0.100 Vpp @ display trig src = rate trig rate = 0.02 Hz