Download
1 / 7
70 likes | 164 Vues
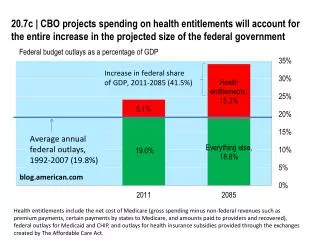
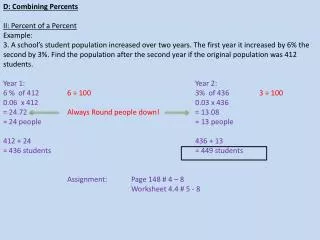
17%. 16%. 15%. 14%. 13%. 12%. 11%. 10%. 9%. 1981. 1983. 1985. 1987. 1989. 1991. 1993. 1995. 1997. 1999. 2001. Logistics as a Percent of GDP. Source: U.S. Department of Commerce. The Bridge to 2007. 2007. 2002. Lube Oil. Vehicle. Engine. Fuel. Aftertreatment.

E N D
17% 16% 15% 14% 13% 12% 11% 10% 9% 1981 1983 1985 1987 1989 1991 1993 1995 1997 1999 2001 Logistics as a Percent of GDP... Source: U.S. Department of Commerce
The Bridge to 2007 2007 2002 Lube Oil Vehicle Engine Fuel Aftertreatment All Systems must be in-place to be a success
(Cost includes price increase plus life cycle operating cost in 2001 Dollars Source: EPA Documents and Industry Analysis) $18,000 $15,980 $16,000 $14,180 $14,000 $12,000 $8,940 $10,000 $8,000 $6,000 $4,000 $2,000 $664 $943 $0 1997 EPA 2000 EPA 2002 EPA Industry Most Upper Bound Estimate Estimate Estimate Likely Estimate Estimate Total Incremental Cost Estimates for 2.5 g/bhp-hr Nox+NMHC Engine / Vehicle vs. Current
Cost Effectiveness of Environmental Benefit From 2.5g/bhp-hr NOx+NMHC Engines October 2002 Implementation $16,000 $14,000 January 2004 Implementation $12,000 $10,000 Cost ($/ton in 2001 dollars) $8,000 $6,000 $4,000 $2,000 $0 Tier 2 Off-Auto Highway 1997 EPA 2000 EPA 2002 EPA 2002 Industry 2002 Industry Estimate Estimate Estimate Estimate Estimate (Source: A.I.R. (Air Improvement Resources) Analysis
Total Cost of ’02 and ’07 Engines 2002 2007 Purchase price $4,500 $16,000 $5,500 $6,000 ______ $11,000 Fuel MPG Maintenance Other (Fuel CPG) Total Operating $7,200 $9,000 $5,100 $21,300 Residual value reduction $5,000 $4,000 Total Cost $18,500 $42,300 NPV (6 years @ 8%) $15,000 $35,000 Arbitrary timeframes coupled with significant technology changes have pushed the burden onto the motor carrier industry
Conclusion • Significant technical challenges. • Potential significant cost impacts. • Fuel / Vehicle / Engine system integration. • Market Impacts • Field evaluations critical. • Purchase incentive required.