Download
1 / 26
320 likes | 673 Vues
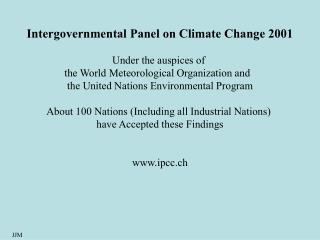
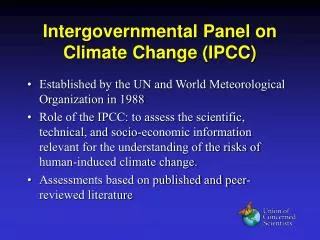
Emissions. Climate change. Impacts. Narratives. Concentrations. The IPCC’s SRES scenarios. The SRES driving forces and storylines. Nakicenovic et al. (2000). Emissi on scenario ’ s (SRES). CO 2. N 2 O. SO 2. CH 4. The SRES scenarios: global quantifications. IPCC (2001).

E N D
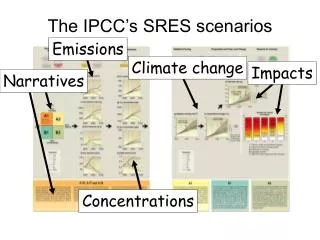
Emissions Climate change Impacts Narratives Concentrations The IPCC’s SRES scenarios
The SRES driving forces and storylines Nakicenovic et al. (2000)
Emission scenario’s (SRES) CO2 N2O SO2 CH4
The SRES scenarios: global quantifications IPCC (2001)
Warming on Continental Scale Red range: Models Black curve: Observations Blue range: Models with only natural forcings
Tropical Cyclones Hurricane Power (PDI) Sea Surface Temperature (August-October) Global Mean Temperature Atlantic Observed data: Hurricane energy closely linked to SST, and increasing (Emanuel, Nature 2005)
IPCC Sea Level Projections 88 cm IPCC 2007: 18 - 59 cm “these ranges do not include uncertainties in carbon-cycle feedbacks or ice flow processes” 70 cm 21 cm 9 cm Tide Gauges
Regional Sea Level Deviations from global mean sea level rise by 2100
Long-term Sea Level: Ice Sheets Volume: 2.8x10¹⁵ m3= 7 meters of sea level Ice sheet response time “is ofthe order of centuries, not millennia”. Hansen (2005)
Vulnerability: Who, to what? Human-environment system humansector humansector ecosystem humansector ecosystem humansector humansector global change Sectors rely on one or more ecosystem services, they interact, they are vulnerable.
Definition of vulnerability Vulnerability is a measure of the likelihood of damage of a system exposed to disturbance e.g. by global change drivers. Vulnerability = f(Exposure, Sensitivity, Adaptive Capacity) V = f(E, S, AC) ATEAM, operational definitionVulnerability is the degree to which an ecosystem service is sensitive to global change plus the degreeto which the sector that relies on this serviceis unable to cope with the changes.
TheATEAMmethodology dialogue between stakeholders and scientists maps of vulnerability modelling framework combined indicators downscaling SRES Vulnerability Assessment multiple scenarios of change in 21st century:climate,land use,N deposition changes in ecosystem services changes in adaptive capacity
TheATEAMmethodology dialogue between stakeholders and scientists maps of vulnerability modelling framework combined indicators downscaling SRES Vulnerability Assessment multiple scenarios of change in 21st century:climate,land use,N deposition changes in ecosystem services changes in adaptive capacity
Exposure – multiple stresses • Climatic change (e.g. temperature rise, change in precipitation pattern) • Atmospheric greenhouse gas and aerosol concentration changes (e.g. CO2, methane, soot, water vapour) • Sea-level rise • Pollution (e.g. deposition of nitrogen, phosphorus, sulphur) • Land use change (e.g. abandonment of land) • Socio-economic change (e.g. markets & welfare)
Multiple scenarios to span a large range of possible futures 2020 2050 2100 A1F, GCM1 A1F, GCM1 A1F, GCM1 A2, GCM1 A2, GCM1 A2, GCM1 B1, GCM1 B1, GCM1 B1, GCM1 B2, GCM1 B2, GCM1 B2, GCM1 natvar, GCM1 natvar, GCM1 natvar, GCM1 A1F, GCM2 A1F, GCM2 A1F, GCM2 A2, GCM2 A2, GCM2 A2, GCM2 B1, GCM2 B1, GCM2 B1, GCM2 B2, GCM2 B2, GCM2 B2, GCM2 ... ... ... ... ... ... ... ... ... 4 GCMs x (4 SRES + 1 natural variation) = 20 scenarios of global change per time slice 1990
ATEAMscenarios of global change • Climate change • Atmospheric CO2 concentration • Land use change • N deposition change • Based on IPCC/SRES • A1F, A2, B1, B2 • Europe, grid 16 x 16 km, • 4 time slices • (1990, 2020, 2050, 2080) Land use: Protected forest. Baseline scenario, 1990.
Agriculture Water Forestry Biodiversity Carbon Storage & Energy Mountains The ATEAMsectors
Examples of adaptation exposure sensitivity adaptation
Adaptive capacity • Knowledge • Awareness • Understanding • Will • Trust • Motivation • Values • Urgency • Power • Freedom • Equity • Technology • Wealth Countries Provinces Cities Villages Sectors Groups Individuals
Fuzzy Logic Approach Freedom index Equality Gini co-efficient Awareness Literacy rate Knowledge Enrolment ratio Population density Urgency Hazard exposure Adaptive Capacity Response Dependency Innovation Unemployment GDP per capita Flexibility Infant mortality Action World trade share Power Budget surplus
Adaptive Capacity 2000 2050 2080 low high