Download
1 / 15
190 likes | 545 Vues
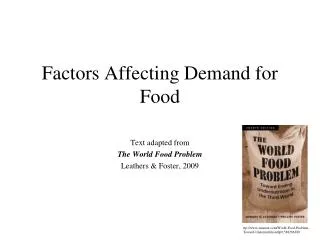
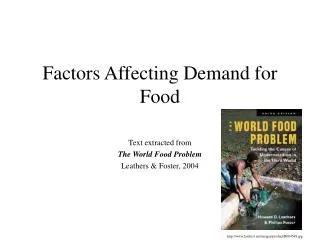
Starter. What three observations can you make from the graph?. Demand for food is increasing. Food production is increasing. Demand often out strips supply. Learning objective. An introduction to the global pattern of food supply and demand. The world on your plate.

E N D
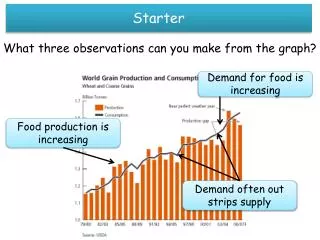
Starter What three observations can you make from the graph? Demand for food is increasing Food production is increasing Demand often out strips supply
Learning objective An introduction to the global pattern of food supply and demand. The world on your plate
Increasing food demand In pairs, think of reasons why global demand for food has risen. Population growth (currently 7.2 billion) Increased standard of living Availability / price of food Improvements in transport and technology More adventurous eating
Food miles The following table shows the origin of some of the foods you may have eaten as part of your Christmas dinner. On your world map, shade and label each country listed. Draw an arrow from each country to the UK. Write the type of food and number of miles travelled along each arrow. The map you have drawn illustrates food miles. Write a definition of this term.
Food miles facts… The UK imports half of our vegetables and 95% of our fruit!
Driving 6.5 miles to buy your shopping emits more carbon than flying a punnet of strawberries from Kenya!
Air-transported green beans from Kenya produce less CO2 emissions than British beans which are grown using oil-based fertilisers, tractors, etc.
Most food imported by the UK has a low carbon footprint because it is transported by sea.
Our Cox and Braeburn apples are stored for 10 months. The amount of energy used to keep them fresh for that time produces a New Zealand!
Food miles v. fair miles The globalised food industry affects livelihoods and environments across the world. Cash crops, like green beans from Kenya, help to sustain the economies of many developing countries - and the lives of many rural poor. Buying their produce can mean the difference between survival and starvation for many small farmers. The term fair miles is used when considering this aspect of the global food industry.
Why transport food so far? Many of the foods we import can be produced in the UK. So why transport goods like potatoes over such long distances? Whilst watching the clip think about the following questions: 1. Egypt is a desert, so how are potatoes grown on a commercial scale? 2. What are the pros and cons of growing potatoes in Egypt? Consider the process and the different people involved. Put your ideas in a table. Potatoes from Egypt
Plenary Write three things that you have learnt today about global food supply and demand.