Download
1 / 16
160 likes | 320 Vues
Assessing the Effectiveness of MBTA Commuter Rail using GIS. Boston Metropolitan Area . Silvia Petrova – Kristopher Kuzera IDCE 388 GIS & Local Planning Final Project - Spring 2004. Introduction. Metropolitan Boston is serviced by an extensive network of commuter trains (11 lines).

E N D
Assessing the Effectiveness of MBTA Commuter Rail using GIS Boston Metropolitan Area Silvia Petrova – Kristopher Kuzera IDCE 388 GIS & Local Planning Final Project - Spring 2004
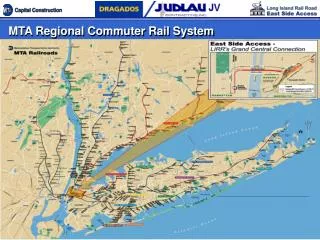
Introduction • Metropolitan Boston is serviced by an extensive network of commuter trains (11 lines). • In 2000, MBTA commuter rail provided service to 119 stations with plans to expand to additional communities within the upcoming years. • 1.5% of the commuting population of Massachusetts commutes by rail.
Objective • Effectiveness is determined as an appropriate number of weekday inbound trains stopping at each station in order to service the amount of allocated commuters (sample data available). • The objective is to assess the effectiveness of the MBTA commuter rail system.
Commuter Statistics per Line http://www.mass.gov/eotc/facts/charts/facts_commuterchart.html
Assumptions • Commuter population boards at the nearest commuter station (Thiessen polygons). • Population within a distance to the nearest stations is equally distributed. • Commuters are identified as only traveling inbound to Boston on a weekday.
MBTA Sample Commuter Density per Census Tract (sq. km.), 2000 Commuter Density is heavily concentrated in the south-west suburbs of Boston.
100 100 90 90 80 80 70 70 60 60 50 50 40 40 30 30 20 20 10 10 Distance in Kilometers Distance in Kilometers MBTA Sample Commuter Density within 100 Km. of Boston, 2000 Most sample commuters live within the 10 to 20km buffer. Commuter Density per 10km buffer 0.04 1.48 13.78
MBTA Sample Commuters per Station, 2000 Sample commuters are allocated to the nearest station.
MBTA Sample Commuters per Weekday Inbound Train, 2000 Stations in yellow have more number of trains per commuters allocated to that station. Stations in dark blue have fewer number of trains per commuters allocated to that station.
What have we learned? • The southern region of Boston has generally more commuters than the northern region. • There are far fewer trains per commuters accommodating the southern region. • A solution would be to increase the number of trains to these stations or to build additional stations to service these commuters.
Problems Encountered • Data of exact number of passengers boarding at each station was unavailable, only sample census data per town. • Data is limited to within Massachusetts and does not include neighboring states and out of state stations (Providence). • Train schedules for 2000 were unavailable so number of trains from today were used.