Download
1 / 1
10 likes | 99 Vues
This study focuses on utilizing read pair information to accurately scaffold P. knowlesi chromosomes, enabling genomic comparisons with P. falciparum. The integration of read pair data enhances synteny analysis, aids in gene prediction, and expedites genome dataset release. Preliminary annotation of SICAvar antigens in P. knowlesi sheds light on virulence mechanisms. The analysis also compares the Ghanian clinical isolate with 3D7, offering insights into pathogen genome variations. By leveraging 3D7 as a reference, contig mapping and pseudochromosome assembly can be achieved for Plasmodium spp. genomes.

E N D
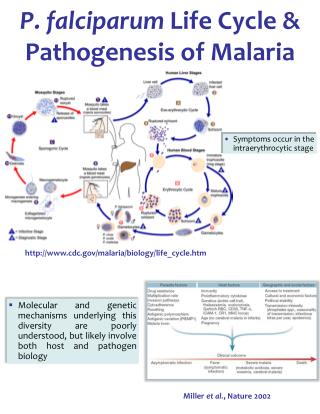
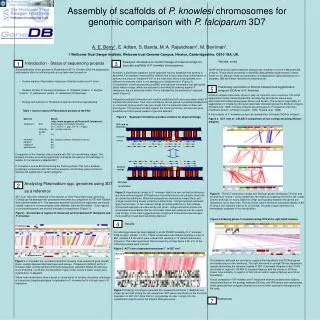
3D7 chrA as reference Ordered contigs A Ordered contigs B 3D7 chrB as reference 3 2 1 7 5 4 P. knowlesi P. falciparum chr7 Assembly of scaffolds of P. knowlesi chromosomes for genomic comparison with P. falciparum 3D7 A. E. Berry1, E. Adlam, S. Banda, M. A. Rajandream1, M. Berriman1. 1 Wellcome Trust Sanger Institute, Welcome trust Genome Campus, Hinxton, Cambridgeshire, CB10 1SA, UK. Results contd Read pair information to confirm linkage of ordered contigs for accurate scaffolds of P. knowlesichromosomes. Introduction - Status of sequencing projects • Since publication of the genome of Plasmodium 3D7 in October 2002 the sequencing and analysis effort is continuing with a long term view focused on: • Human malaria:Plasmodium falciparum, Ghanian isolate and IT strain. • Disease models: P. knowlesi (macaque), P. chabaudi (rodent), P. berghei (rodent), P. gallinaceum (avian), P. reichenowi (chimpanzee). • Biology and evolution of Plasmodium species and other apicomplexa. • Table 1 Current status of Plasmodium projects at the PSU SNAP and projector gene prediction analysis has resulted in a set of 5186 predivted proteins. These will be presented in GeneDB (www.genedb.org/pknowlesi/) (Hertz- fowler et. al.) Manual review and annotation of snap/projector gene predictions is in progress, 286 have been manually reviewed thus far. • However, a significant drawback to this approach has the drawback that synteny is assumed. For example, the possibility remains that a locus may show conservation of synteny to a locus on falciparum chr1 at the local level, but is in fact present on a different chromsome which is not analogous to falciparum chr1 (Figure 2). • Consideration of both sequencing and BAC end read pair information can distinguish cases where contigs, which are assumed to be linked by ordering against Pfalciparum, are not physically linked. This is indicated by the presence of unpaired reads (Figure 2). • Integrating read pair information will result in scaffolds which more accurately reflect P. knowlesi chromosomes. Thus more confidence can be placed in predicted breakpoints in conserved synteny which may give insight into the molecular basis of observed phenotypes. This process will also support the finishing process, aid accurate gene prediction and thus speed release of genome datasets, • Figure 2 Read pair information provides evidence for physical linkage Preliminary annotation of Shizont-Infected Cell Agglutination antigens SICAvar in P. knowlesi. SICAvar antigens have been shown to play an important role in virulence. The SICA agglutination assay demonstrated that recrudescing parasitemic waves were associated with variant phenotypes (Brown and Brown). The proteins responsible for agglutination of infected erythrocytes were later characterised as the SICAvar antigens (Howard et al, 1983). SICAvar antigens are analogous to Pfalciparum erthrocyte membrane protein -1(Pfemp1) (Leech., 1984; Howard et al., 1988). A first analysis of P. knowlesi contigs has revealed four full length SICAvar antigens. Figure 4 ACT view of a BLASTn comparison of four contigs encoding SICAvar antigens 1 2 Comparison of the Ghanian clinical isolate with 3D7 is in preliminary stages. This analysis provides an exciting opportunity to analyse the genome of a pathogen in relation to the laboratory adapted 3D7. P. knowlesi is now at 8X and entering the finishing phase. This has a enabled preliminary comparison with 3D7 and an analysis of 5 SICAvar genes (Schizont-infected cell agglutination variant antigens). 3 Analysing Plasmodium spp. genomes using 3D7 as a reference 4 Figure 2 Hypothetical contigs of P. knowlesi (light blue and red horizontal boxes) are show ordered against 3D7(dark blue horizontal boxes) using tblastx. Blast hits are shown by red blocks. Matched read pairs are denoted by inward black and orange inward facing arrows joined by a dotted lines. Orange matched read pairs span the boundary of two ordered contigs providing evidence for their linkage. Unmatched read pairs are denoted by red, green, orange and violet arrows and accumulate at boundaries that are not linked. Read pair evidence can be used to map contigs, in this case suggesting that contigA and B should be interchanged, thus resulting in read pairs becoming matched. Figure 5 The ACT comparison shows four SICAvar genes (red boxes).The first and second have 10 and 7 exons repectively, the third is truncated by the end of the contig, and the forth has 12 exons. Blast hits (High scoring pairs) between the genes are denoted by red or blue lines. The hits shown have a minimum nucleotide identity of 80 %. A blue line indicates that the hit is inverted. The green region denotes 2 kb immediately upstream of the start position. 3D7 is an important reference in the analysis of other Plasmodium spp. genomes. Contigs can be arranged into pseudochromosomes by comparison to 3D7 with TBlastX and ordered relative to it. This approach assumes that since the organisms are closely related, regions of conserved gene order between them will be evident. Such regions of conserved synteny are present throughout comparisons (Figure 1), Figure1 An example of regions of conserved synteny between P. falciparum and P. knowlesi. Figure 6 Ordering places Pknowlesi contig 4778 at the right hand telomere Results An ordering process has been applied to an 8X PHRAP assembly of P. knowlesi 2766 contigs ( median 1.7 kb ). These contigs were size filtered resulting in a set of 890 (median 5.8 kb) which were ordered into resulting in 14 metachromosomes (Figure 3). The ordering process first removed any contigs below 5 kb. Z % of the remaining contigs were ordered. Figure 3 ACT view of pseudochromosome 7 to 3D7 chr7 Pkn chr7 This analysis, although not conclusive supports the hypothesis that SICAvar genes are located close to the telomeres. The right hand end of contig4778 has heptameric repeats resembling the telomeric heptad of 3D7 (1 arrowed). Regions in the 3’UTR are similar to regions in REP20 (2 arrowed).Regions with the introns of SICAvar shown have similarity to regions of VAR introns and/or regions flanking exon/intron boundaries. Future comparison of Pknowlesi and Pfalciparum telomeric/subtelomeric regions should shed light on the analogy between SICAvar and VAR genes and mechanisms which generate their antigenic diversity and control their expression throughout the life cycle. Figure 1. P. Knowlesi top, six frame translation showing snap generated gene models (blue), contigs depicted alternate brown and orange. Pfalciparum (bottom) as for P. knowlesi. Near vertical red bars joining the sequences represent tblastx hits above a score threshold of 135 bits. Conservation of gene order, and to a lesser extent exon organisation, is apparent. Yellow near vertical bars show a break in conservation of synteny. A putative orthologue of a proposed lysophospholipase is duplicated in P. knowlesi but Is in single copy in P. falciparum. 3D7chr7 Figure 3 Ordering of contigs to generate Pkn pseudochromosome 7. Blast hits are shown by red lines joining the two sequences. 3D7 genes are shown on the six frame translation of 3D7 chr7. Note that it is not possible to order contigs onto the subtelomeric regions and to the internal VAR gene array. References