Download
1 / 24
240 likes | 375 Vues
This report provides comprehensive data on dialysis methods, patient demographics, and transplantation statistics in Australia and New Zealand from 1990 to 1996. It highlights the prevalence of end-stage renal failure, the distribution of dialysis methods, and the mortality rates of patients. Also included are insights on the acceptance rates of new patients, age profiles, deaths among diabetic and non-diabetic patients, and transplant operations. Understanding these statistics is vital for health policy development and resource allocation in renal care.

E N D
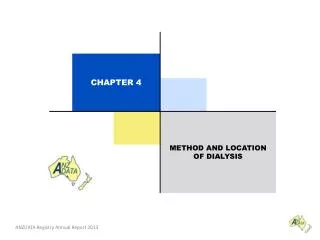
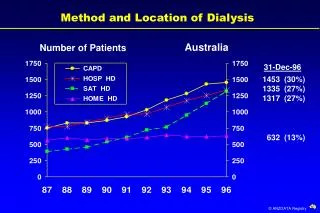
Method and Location of Dialysis Australia Number of Patients 31-Dec-96 1453 (30%) 1335 (27%) 1317 (27%) 632 (13%)
Method and Location of Dialysis New Zealand Number of Patients 31-Dec-96 530 (57%) 189 (20%) 181 (19%) 4 (<1%)
Dialysis Population Per Million 1990 - 1996States: Australia and New Zealand Patients Per Million No. Pats. 1996729 1915 1226 97 312 127 456 4862 932
New Patients (Per Million) Australia 1990 - 1996 No. Pats. 1405 951 981 1086 1383 1159 1314
New Patients (Per Million) Australian States 1996 No. Pats. 117 227 535 344 30 105 47
Age of New Patients - Australia 1996 New Patients (1405) Median Age 59.4 yrs Per Million Age Group 9 7 17 40 61 94 196 312 161 25 0 0 2 24 24 25 23 15 6 0 Diabetic % Type 1 0 0 2 18 15 5 2 1 0 0
Acceptance of New Patients 1987 - 1996 Age Specific Rates - Australia Patients Per Million
Annual Death Rate Per 100 Dialysis Patient YearsAustralia 1992 - 1996 All Patients 15.7 15.6 15.3 15.0 15.6 92 93 94 95 96 Deaths Diab Pts at risk NonDiab 432 493 532 594 Deaths 465 3907 4514 4837 5161 Pts at risk 4177
Annual Death Rate Per 100 Patient YearsMode of Dialysis Australia 1992 - 1996 278 190 176 199 215 Deaths CAPD 1534 1729 1872 2065 2134 Pts Risk 313 365 390 421 431 Deaths HD 3487 3227 3815 4119 4442 Pts Risk
Graft Loss in Relation to Grafts at RiskAustralia 1987 - 1996 No. Grafts Lost 208 239 228 241 261 285 237 263 255 228
81 83 82 85 86 84 86 85 91 90 Australian Transplantation 1986 - 1996 12 month graft survival CD1
No. Patients Proportion of Patients Awaiting Transplant 31-Mar-97 Australia 31% % of Age Group Patients 1533 Patients Age Group 3 17 106 240 362 420 311 74 0
No. Grafts 80 171 118 16 57 3 30 Transplant Operations (Per Million)Australian States 1996 Australia 26 (n=475) Tasmanian residents transplanted in Victoria Northern Territory residents transplanted in South Australia
Transplants Operations PerformedAustralia 1987 - 1996 Operations Per Million No. Grafts
Functioning Transplants Per Million 1990 - 1996Transplanting States: Australia and New Zealand Patients Per Million No. Pats 1996 839 1545 1158 510 362 4418 825
Functioning Transplants (Per Million)Australia and New Zealand
Functioning Transplants (Per Million)Caring Australian States 1996
Primary Cadaver Patient Survival 1987 - 1995 Related to Year of Transplant Patient Survival Year
Primary Cadaver Graft Survival 1987 - 1995 Related to Year of Transplant Graft Survival Year
First C.A.P.D to Peritonitis 1.4.91 - 31.3.97 Australia and New Zealand Percentage Survival Age Group
Duration of Dialysis TreatmentThree Sessions Per Week Australia Number of Patients (31 March)
Haemodialysis Surface Area Australia Number of Patients (31 March) 1996 11 141 97 193 664 481 424 7 516 138 188 12 83 11 68 7 1997 7 94 208 181 552 501 444 10 567 276 203 22 97 19 147 14
Prevalence and Incidence 1987 - 1996 End Stage Renal Failure - Australia Number of Patients ( ) Per Million Dialysis (266) Functioning Transplant (242) New Pts (77) Deaths (40) Transplant Ops (26)
Prevalence and Incidence 1987 - 1996End Stage Renal Failure - New Zealand Number of Patients ( ) Per Million Dialysis (256) Functioning Transplant (226) New Pts (78) Deaths (44) Transplant Ops (26)