Download
1 / 35
350 likes | 510 Vues
The Relationship of Cosmic Rays to the Environment. Erwin O. Flückiger Physikalisches Institut University of Bern erwin.flueckiger@space.unibe.ch ECRS 2008 – Ko šice – 11 September 2008. Ionisation * Ionisation Rate * Ion Concentration * Global Electric Circuit - Commmunication

E N D
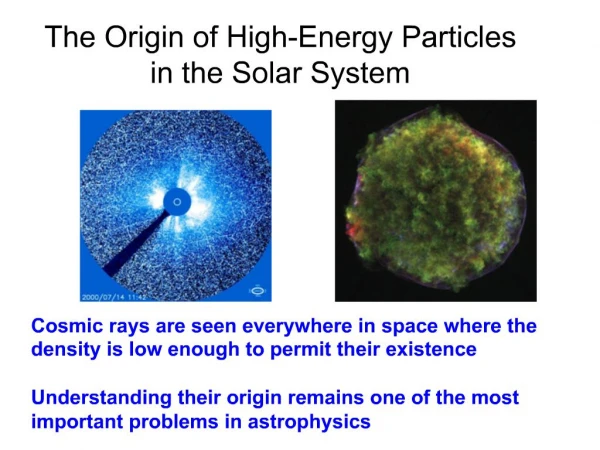
The Relationship of Cosmic Rays to the Environment Erwin O. Flückiger Physikalisches Institut University of Bern erwin.flueckiger@space.unibe.ch ECRS 2008 – Košice – 11 September 2008
Ionisation * Ionisation Rate * Ion Concentration * Global Electric Circuit - Commmunication - E-Fields, Lightnings, Thunderclouds - Air Conductivity - Hurricanes * Catalytic Reactions - Ozone - Nitrates * Weather and Climate - Mesosphere – lower Thermosphere Dynamics - Temperature - Rain - Lightning - CR and Clouds Nuclear Interactions * Particle Fluxes, Spectra * Cosmogenic Isotopes Radiation Effects Epidemic Flu Genetic Mutations CR as Diagnostic Tool
Review Papers e.g. Bazilevskaya, G.A, M.B. Krainev, and V.S. Makhmutov, Effects of cosmic rays on the Earth‘s environment, Journal of Atmospheric and Solar-Terrestrial Physics 62, 1577–1586, 2000 Stozhkov, Y.I., The role of cosmic rays in atmospheric processes, J. Phys. G: Nucl. Part Phys. 29, 913-923, 2003
Simulation of the Cascades in the Atmoshere PLANETOCOSMICS GEANT4 Application Interaction of cosmic rays with Planet Atmospheres and Soils http://cosray.unibe.ch/~laurent/planetocosmicshttp://cosray.unibe.ch/~laurent/magnetocosmics Atmospheric cascade initiated by a 1 GeV proton Laurent Desorgher
Cosmic Rays in the Earth‘s Atmosphere Neutrons are still a problem!
Rule of Thumb ~ 5 μSv / hr Cosmic Ray Contribution to Radiation Dose
Radiation Exposure at Aircraft Altitude LIULIN measurements of GLE 60 during PRG-JFK flight Beck et al., 2006
The 13 December 2006 Solar Particle EventRadiation Exposure at Aircraft Altitude Flückiger et al., ICRC 2007 Workshop
The 13 December 2006 Solar Particle EventRadiation Exposure at Aircraft Altitude Flückiger et al., ICRC 2007 Workshop
GCR SCR Magnetospheric Particles Geomagnetic Storms Electromagnetic Radiation UV & X-ray Radioactive Constituents Lightning Ion Production in the Earth‘s Atmosphere At altitudes of ~3 to 35 km, cosmic rays are practically the only ionisation source
Ion Production and Ion Concentration in the Earth‘sAtmosphere Ion production rate q q = I ρσ / M where I = I (h, Rc, Φ) cosmic ray flux ρ air density σ effective ionisation cross section 2 x 10-18 cm2 at h ≤ 20 km M average mass of air atom Ion concentration n q = α n2α 3D recombination coefficient Stozhkov, 2003 q(h) = β(h) n(h) β(h) linear recombination coefficient
Ionization by GCR Monthly averaged fluxes of ionizing particles in the atmosphere over Murmansk region as measured by an omnidirectional Geiger counter Bazilevskaya et al., 2007
Ionization by GCR & SCR Bern Model: http://cosray.unibe.ch/~laurent/planetocosmics Desorgher et al., AOGS 2004
Stratosphere ΔV ≈ 108 -109 V The thunderclouds are the generators of the global electric circuit Troposphere quiet perturbed Atmosphere Global Electric Circuit Ja≈ 10-12 A m-2 Total atmospheric current ~ 1800 A E ≈ - 130 V/m Q ≈ - 600 000 C adapted from Stozhkov, 2003
CR & Atmospheric Current Yearly averages of atmospheric electric current J (Roble 1985) and cosmic ray flux I at h 20 km in the polar region Stozhkov, 2003
CR & Lightning Yearly number of lightning L detected in the USA in 1989-1998 (black points; Orville & Huffines, 1999) and ion production rate q in the air column (h = 2 – 10 km) at middle latitudes (open points). Stozhkov, 2003
Fd GLE CR & Precipitation Changes in the daily precipitation level D [%], relative to the mean value during one month before (days -30 to -1) and one month after (days 1 to 30) the event Left: Forbush decrease - Right: GLE Stozhkov, 2003
Ozone, Nitrates and Temperature • Scenario of large solar proton event • energetic protons ionize major atmospheric constituents → transformation to intermediate water clusters → further clustering and dissociative recombination → production of H and OH („odd hydrogen“ ). • NO is the result of dissociation of N2 and a series of recombination reactions involving nitrogen and its ions. • Enhanced production of „odd nitrogen“ (complex of nitrate radicals designated by the symbol NOy). • Ozone destruction: 2 Cycles • HOx (H, OH, HO2) above 50 km Ozone depletion through HOx follows the time profile of the ionization nearly instantaneously • NOx (NO, NO2) below 50 km NOx induced ozone depletion has a long time constant • Temperature drop Rohen et al., 2005
OH + O → H + O2 NO2 + O → NO + O2 H + O3 → OH + O2 NO + O3 → NO2 + O2 NetO + O3 → O2 + O2 O + O3 → O2 + O2 mainly above 50 km mainly below 50 km follows the time profile of the long time constant ionization nearly instantaneously Ozone Destruction
HNO3 (a good proxy for NOy): 15-31/01/2005 Contours of averaged HNO3 (volume mixing ratio) values during the second part of January 2005). Selected location: ~75°-82°N. The HNO3 increase can be the result of: - the OH and NO2 raise during SEP events; - through the reaction of water cluster ions with NO3 . ICRC 2007, Paper 1009, Storini & Damiani
SCR Induced N2O Variations October / November 2003 Data from MIPAS instrument (limb emission Fourier transform spectrometer) onboard ENVISAT satellite: Northern Polar Hemisphere (40°N - 90°N) distributions of N2O (in ppbv, parts per billion by volume) for days from 26 October to 11 November 2003 at an altitude of 58 km. Nighttime data only. Contours are zonally smoothed within 700 km. Funke et al., Atmos. Chem. Phys. 8, 3805-3815, 2008
SCR Induced N2O Variations October / November 2003 Time series of N2O abundance (in ppbv) after the solar proton events of October–November 2003 for the Northern Hemisphere polar cap (70°–90°N) during nighttime conditions. Left: MIPAS measurements. Right: Simulations by the Canadian Middle Atmosphere Model Funke et al., Atmos. Chem. Phys. 8, 3805-3815, 2008
SCR Induced OH, NO, and O3 Variations Model Calculations for October 1989 at 70°N, 30°E Midday OH changes [%] Ionisationrate[cm-3s-1] Midday O3 changes [%] Midday NO changes [%] Ondrášková & Krivolutsky, J. Atm. & Solar-Terrestrial Physics 67, 211-218, 2005
SCR & Sulfate/Nitrate Aerosol 20 January 2005 GLE TOMS (Total Ozone Mapping Spectrometer) Aerosol optical depth index (AI) Evidence for an increase in the concentration of sulfate or nitrate aerosol on the second day after the GLE in the south magnetic pole region with the maximum penetration of solar cosmic rays. Sites from the TOMS aerosol index data set Mirinova et al., 2008
SCR Induced Ozone Change Ozone depletion rates above 60°N geomagnetic latitude (solid line), model results (stars) and GOES-11 15–40 MeV proton flux (blue points). The altitude is 54.4 km and the observation and model data are daily and zonally averaged. The reference period is 20–24 October, 2003. Rohen et al., JGR 110, A09S39, 2005
SCR Induced Ozone Change Change of ozone concentration at 49 km altitude in the NH and SH in a global view. Changes are shown for different time periods in each hemisphere, respectively. The reference period is 20–24 October 2003. Evidently the ozone depletion is confined to the geographic and geomagnetic poles. Rohen et al., JGR 110, A09S39, 2005
GOES-11 Andenes~ 90 km ΔT > 25K SCR Induced Temperature Change October / November 2003 Pancheva et al., J. Atm. & Solar-Terrestrial Physics 69, 1075-1094, 2007
GLE induced Nitrate in Ice Cores Scenario according to CR community Enhanced production of „odd nitrogen“ during large solar proton event Some of the HNO3 is transported to the troposphere, where it is precipitated within short time (~ 1yr) downward to the surface → deposition in polar ice Atmospheric chemists and physicist do not (yet) believe this last point!However: Contemporary state-of-the-art measurements of the denitrification of the polar atmosphere find significant nitric acid trihydrate particles (called NATrocks) in the polar stratospheric clouds.
Observations of Impulsive Nitrate Enhancements Associated With Ground-Level Cosmic Ray Events 1-4 (1942-1949) ICRC 2007, Paper 725,Kepko et al.
The Carrington Event Carrington [1860] and Hodgson [1860] independently observed a white light flare on September 1, 1859, which was accompanied by a large geomagnetic crochet. omnidirectional fluence (>30 MeV): 18.8 x 109 cm-2 McCracken et al.,JGR,106(A10), 21’585–21’598, 2001
Identification of Super GLEs in Ice 70 Impulsive Nitrate Events (30 MeV Proton Fluence >2 x 109 cm-2) between 1561–1950 McCracken et al., JGR 106(A10), 21’585–21’598, 2001
Different Communities Environmental ResearchAtmospheric Chemistry and PhysicsCutting edge sensors onboard satellites- MIPAS (HNO3 NO2)- GOMOS (NO2)- HALOE (NH, NOx Ozone)- POAM - SAGE - OSIRIS- ….Multi-Satellite Data Analysis Atmospheric ModelsWACCM3 Whole Atmosphere Community Climate ModelCMAM Canadian Middle Atmosphere ModelTIME-GCM Thermosphere Ionosphere Mesosphere Electrodynamic General Circulation Model GCM General Circulation Model and 3D chemical global transport-photochemical middle atmosphere model SLIMCATTransport and full chemistry, coupling between chemistry, transport and circulation ….. Cosmic RaysCosmic Ray Detectors(ground based and in space)Ionisation Models- Oulu Model (Usoskin)- Bern Model (Desorgher)- Sofia Model (Velinov)- BOB2 Model (Kallenrode)- …..
Cosmic Rays as Diagnostic Tools Atmospheric front approaching Moscow region 26/06/05 08:22 ICRC 2007, Paper 296, Timashkov et al.
Analysis of muon flux variations during the hurricane in Dubna (June 26, 2005) ICRC 2007, Paper 296, Timashkov et al.
Summary The relations between galactic / solar cosmic rays and our environment are manifold: • via nuclear reactions → Cosmic ray shower → Radiation effects → Production of cosmogenic isotopes • via ionisation → Global electric circuit → Nitrate enhancement → Ozone depletion→ Temperature changes → ??? • via using CR as diagnostic tools The environmental science community is working extensively on the effects of SPEs on atmospheric chemistry and physics, using state of the art satellite instruments and complex models Inter- / Transdisciplinary Resarch Cosmic ray community must become more active and bring in expertise