Download

1 / 27
270 likes | 310 Vues
Explore the disconnect between exchange rates and macroeconomic fundamentals in various countries, along with the impact on trade. Analysis includes carry trade, interest rate differentials, and undervalued currencies.

E N D
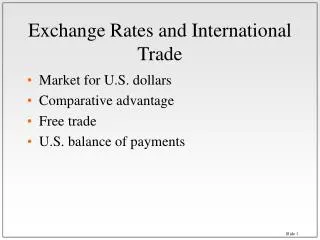
Exchange Rates and Trade Mr. Heiner Flassbeck Director, Division on Globalization and Development Strategies, UNCTAD Geneva, 28th March 2012
Exchange rates have become disconnected from macroeconomic fundamentals Real effective exchange rate, selected countries, 2000–2011 (Index numbers, 2005 = 100, CPI based), source: IMF 2
Exchange rates have become disconnected from macroeconomic fundamentals Real effective exchange rate, selected countries, 2001–2010 (Index numbers, 2005 = 100, ULC based), source: UNCTAD Secretariat calculation based on Economist Intelligence Unit and OECD for ULC data
Carry trade vis-à-vis Japanese Yen, 2005-2012 (Per cent) Source: UNCTAD secretariat calculations, based on IMF, International Financial Statistics database; and national sources. Note:A positive change in the exchange rate indicates an appreciation of the currency concerned. Interest rate differential is calculated considering difference between selected currencies and the yen-denominated asset. Monthly data.
Carry trade vis-à-vis Japanese Yen, 2005-2012 (Per cent) Source: UNCTAD secretariat calculations, based on IMF, International Financial Statistics database; and national sources. Note: A positive change in the exchange rate indicates an appreciation of the currency concerned. Interest rate differential is calculated considering difference between selected currencies and the yen-denominated asset. Monthly data.
Carry trade vis-à-vis Japanese Yen, 2005-2012 (Per cent) Source: UNCTAD secretariat calculations, based on IMF, International Financial Statistics database; and national sources. Note:A positive change in the exchange rate indicates an appreciation of the currency concerned. Interest rate differential is calculated considering difference between selected currencies and the yen-denominated asset. Monthly data.
International reserves and net portfolio investment, 2005-2011 Source: Unctad Secretariat calculations, based on IMF, International Financial Statistics database. Note: Total reserves correspond to total reserves minus Gold and an increase in reserves corresponds capital outflows. Quarterly data.
General pattern for exchange rate adjustment Deviations of nominal effective exchange rate from effective purchasing power parity, Brazil,1995-2010 (2000 = 100), source: UNCTAD Secretariat
General pattern for exchange rate adjustment Deviations of nominal effective exchange rate from effective purchasing power parity, Argentina,1991-2010 (2005 = 100), source: UNCTAD Secretariat
General pattern for exchange rate adjustment Deviations of nominal effective exchange rate from effective purchasing power parity, China,1987-2010 (2000 = 100), source: UNCTAD Secretariat
General pattern for exchange rate adjustment Deviations of nominal effective exchange rate from effective purchasing power parity, Republic of Korea,1984-2010 (2000 = 100), source: UNCTAD Secretariat
General pattern for exchange rate adjustment Deviations of nominal effective exchange rate from effective purchasing power parity, Thailand,1980-2010 (2000 = 100), source: UNCTAD Secretariat
Exchange Rates and Trade Thank you
General pattern for exchange rate adjustment Deviations of nominal effective exchange rate from effective purchasing power parity, Malaysia,1980-2010 (2000 = 100), source: UNCTAD Secretariat
General pattern for exchange rate adjustment Deviations of nominal effective exchange rate from effective purchasing power parity, Iceland,1989-2010 (2000 = 100), source: UNCTAD Secretariat
General pattern for exchange rate adjustment Deviations of nominal effective exchange rate from effective purchasing power parity, Sweden,1980-2010 (2000 = 100), source: UNCTAD Secretariat
General pattern for exchange rate adjustment Deviations of nominal effective exchange rate from effective purchasing power parity, Italy,1984-2010 (2005 = 100), source: UNCTAD Secretariat
General pattern for exchange rate adjustment Deviations of nominal effective exchange rate from effective purchasing power parity, Hungary,1995-2010 (2000 = 100), source: UNCTAD Secretariat
General pattern for exchange rate adjustment Deviations of nominal effective exchange rate from effective purchasing power parity, South Africa,1995-2010 (2000 = 100), source: UNCTAD Secretariat
General pattern for exchange rate adjustment: undervalued currencies Deviations of nominal effective exchange rate from effective purchasing power parity, Germany,1980-2010 (2000 = 100), source: UNCTAD Secretariat
General pattern for exchange rate adjustment: undervalued currencies Deviations of nominal effective exchange rate from effective purchasing power parity, United Kingdom,1980-2010 (2000 = 100), source: UNCTAD Secretariat
General pattern for exchange rate adjustment: undervalued currencies Deviations of nominal effective exchange rate from effective purchasing power parity, Switzerland,1980-2010 (2000 = 100), source: UNCTAD Secretariat
General pattern for exchange rate adjustment: undervalued currencies Deviations of nominal effective exchange rate from effective purchasing power parity, Canada,1980-2010 (2005 = 100), source: UNCTAD Secretariat
General pattern for exchange rate adjustment: undervalued currencies Deviations of nominal effective exchange rate from effective purchasing power parity, United States,1980-2010 (2000 = 100), source: UNCTAD Secretariat
General pattern for exchange rate adjustment: undervalued currencies Deviations of nominal effective exchange rate from effective purchasing power parity, Japan,1980-2010 (2000 = 100), source: UNCTAD Secretariat
General pattern for exchange rate adjustment: undervalued currencies Deviations of nominal effective exchange rate from effective purchasing power parity, Australia,1980-2010 (2005 = 100), source: UNCTAD Secretariat
General pattern for exchange rate adjustment: undervalued currencies Deviations of nominal effective exchange rate from effective purchasing power parity, New Zealand,1980-2010 (2005 = 100), source: UNCTAD Secretariat