Download

1 / 36
360 likes | 473 Vues
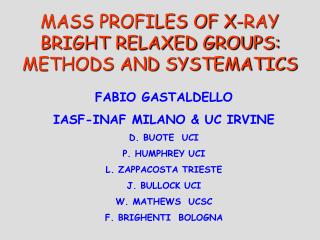
MASS AND ENTROPY PROFILES OF X-RAY BRIGHT RELAXED GROUPS. FABIO GASTALDELLO UC IRVINE & BOLOGNA D. BUOTE P. HUMPHREY L. ZAPPACOSTA J. BULLOCK W. MATHEWS UCSC F. BRIGHENTI BOLOGNA. MASS RESULTS AND c-M PLOT FOR X-RAY GROUPS ENTROPY PROFILES FOCUS ON SOME PARTICULAR OBJECTS. OUTLINE.

E N D
MASS AND ENTROPY PROFILES OF X-RAY BRIGHT RELAXED GROUPS FABIO GASTALDELLO UC IRVINE & BOLOGNA D. BUOTE P. HUMPHREY L. ZAPPACOSTA J. BULLOCK W. MATHEWS UCSC F. BRIGHENTI BOLOGNA
MASS RESULTS AND c-M PLOT FOR X-RAY GROUPS • ENTROPY PROFILES • FOCUS ON SOME PARTICULAR OBJECTS OUTLINE
DM DENSITY PROFILE The concentration parameter c do not depend strongly on the innermost data points, r < 0.05 rvir (Bullock et al. 2001, B01; Dolag et al. 2004, D04). Navarro et al. 2004
c slowly declines as M increases (slope of -0.1) • Constant scatter (σlogc ≈ 0.14) • the normalization depends sensitively on the cosmological parameters, in particular σ8 and w (D04,Kuhlen et al. 2005). c-M RELATION Bullock et al. 2001
Selection Effects Wechsler et al. 2002 Concentrations for relaxed halos are larger by 10% compared to the whole population (Jing 2000, Wechsler 2002, Maccio’ 2006). They show also smaller scatter (σlogc ≈ 0.10)
Chandra XMM-Newton A SPECIAL ERA IN X-RAY ASTRONOMY • High sensitivity due to high effective area, i.e. more photons • 1 arcsec resolution
Vikhlinin et al. 2006 Pointecouteau et al. 2005 • NFW a good fit to the mass profile • c-M relation is consistent with no variation in c and with the gentle decline with increasing M expected from CDM (α = -0.040.03, P05). Clusters X-ray results
Improve significantly the constraints on the c-M relation by analyzing a wider mass range with many more systems, in particular obtaining accurate mass constraints on relaxed systems with 1012 ≤ M ≤ 1014 Msun • There are very few constraints on groups scale (1013 ≤ M ≤ 1014 Msun), where numerical predictions are more accurate because a large number of halo can be simulated. THE PROJECT
In Gastaldello et al. 2007 we selected a sample of 16 objects in the 1-3 keV range from the XMM and Chandra archives with the best available data with • no obvious disturbance in surface brightness at large scale • with a dominant elliptical galaxy at the center • with a cool core • with a Fe gradient • The best we can do to ensure hydrostatic equilibrium and recover mass from X-rays. SELECTION OF THE SAMPLE
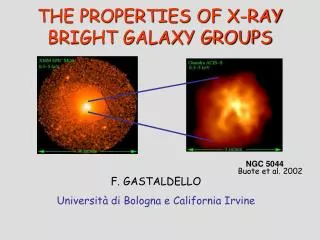
After accounting for the mass of the hot gas, NFW + stars is the best fit model RESULTS MKW 4 NGC 533
No detection of stellar mass due to poor sampling in the inner 20 kpc or localized AGN disturbance RESULTS Buote et al. 2002 NGC 5044
NFW + stars best fit model • We failed to detect stellar mass in all objects, due to poor sampling in the inner 20 kpc or localized AGN disturbance. Stellar M/L in K band for the objects with best available data is 0.570.21, in reasonable agreement with SP synthesis models (≈ 1) • Adopting more complicated models, like introducing AC or N04 did not improve the fits. AC produces too low stellar mass-to-light ratios RESULTS
c-M relation for groups We obtain a slope α=-0.2260.076, c decreases with M at the 3σ level
THE X-RAY c-M RELATION • Buote et al. 2007 c-M relation for 39 systems ranging in mass from ellipticals to the most massive galaxy clusters (0.06-20) x 1014 Msun. • A power law fit requires at high significance (6.6σ) that c decreases with increasing M • Normalization and scatter consistent with relaxed objects
THE X-RAY c-M RELATION WMAP 1 yr Spergel et al. 2003
THE X-RAY c-M RELATION WMAP 3yr Spergel et al. 2006
CLUSTERS PREFER HIGH σ8 Evrard et al. 2007
CLUSTERS PREFER HIGH σ8 Evrard et al. 2007
HE (10-15% from simulations, e.g. Nagai et al. 2006, Rasia et al. 2006). No results yet on the magnitude for the bias on c (if there is one) due to radial dependence of turbulence • Selection bias • Semi-analytic model prediction of c-M • Gas physics and AC (problems also with rotation curves of spirals: Kassim et al. 2006, Gnedin et al. 2006 but also positive claims: M31 mass model of Seigar et al. 2007) • Extend the profiles at large radii (r500 is possible to reach for groups) CAVEATS/FUTURE WORK
The crucial mass regime of groups has provided the crucial evidence of the decrease of c with increasing M • c-M relation offers interesting and novel approach to potentially constrain cosmological parameters • See constraints on the c-z relation (poster by L. Zappacosta) MASS CONCLUSIONS
THE BASELINE INTRACLUSTER ENTROPY PROFILE FROM GRAVITATIONAL STRUCTURE FORMATION VOIT ET AL. 2005
COMPARISON WITH MASSIVE CLUSTERS AND GRAVITATIONAL SIMULATIONS PRATT ET AL. 2006
COMPARISON WITH MASSIVE CLUSTERS AND GRAVITATIONAL SIMULATIONS
COMPARISON WITH MASSIVE CLUSTERS AND GRAVITATIONAL SIMULATIONS
ENTROPY PROFILES FOR AGN HEATING VOIT ET AL. 2006
ENTROPY PROFILES NGC 4325 AGN DISTURBANCE: RUSSELL ET AL. 2007
“In this scenario there is a clear dichotomy between active and radio quiet clusters: one would expect the cluster population to bifurcate into systems with strong temperature gradients and feedback and those without either” Donahue et al. 2005 AWM4 AND AGN FEEDBACK
BROKEN POWER LAW ENTROPY PROFILES FOR GROUPS WITH STEEPER INNER SLOPES AND FLATTER OUTER SLOPES SEEM TO POINT TO HIGHER IMPORTANCE OF LOCAL AGN HEATING INTERPLAY BETWEEN AGN AND MERGINGS THE PUZZLE AWM4 (MORE DATA: RADIO, POSTER BY S. GIACINTUCCI, CHANDRA !) ENTROPY CONCLUSIONS