Methodology for Assessing RFI Contamination in Oceanic Areas Using Numerical Indicators
30 likes | 159 Vues
This study aims to develop a methodology and numerical indicator to quantify Radio Frequency Interference (RFI) contamination in oceanic regions. Utilizing outlier detection results from L2OS processing, it analyzes data from four oceanic zones—three known for RFI impact and one mid-Pacific control sample. Key metrics, such as the percentage of outliers and the proportion of gridpoints with over 20% outlier measurements, provide insights into the extent of RFI contamination. This approach enhances understanding of RFI's effects on ocean monitoring.

Methodology for Assessing RFI Contamination in Oceanic Areas Using Numerical Indicators
E N D
Presentation Transcript
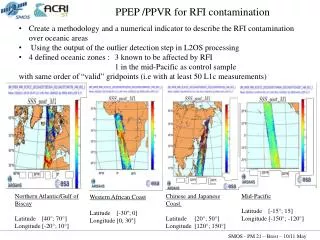
Create a methodology and a numerical indicator to describe the RFI contamination over oceanic areas • Using the output of the outlier detection step in L2OS processing • 4 defined oceanic zones : 3 known to be affected by RFI 1 in the mid-Pacific as control sample • with same order of “valid” gridpoints (i.e with at least 50 L1c measurements) PPEP /PPVR for RFI contamination SMOS - PM 21 – Brest – 10/11 May
Methodology : From the most recent half-orbits acquired above these zones • Extract from the DAP, for each gridpoint: the number of outliers’ measurements Dg_num_outlier the number of avalaible measurements Dg_num_meas_l1c • Compute the percentage of outliers’ measurements for gridpoints associated with at least 50 L1c measurements • Focuse on the proportion of gridpoints with more than 20% of outliers’ measurements : proportion of these gridpoints extent of RFI contamination SMOS - PM 21 – Brest – 10/11 May