Download
1 / 29
290 likes | 516 Vues
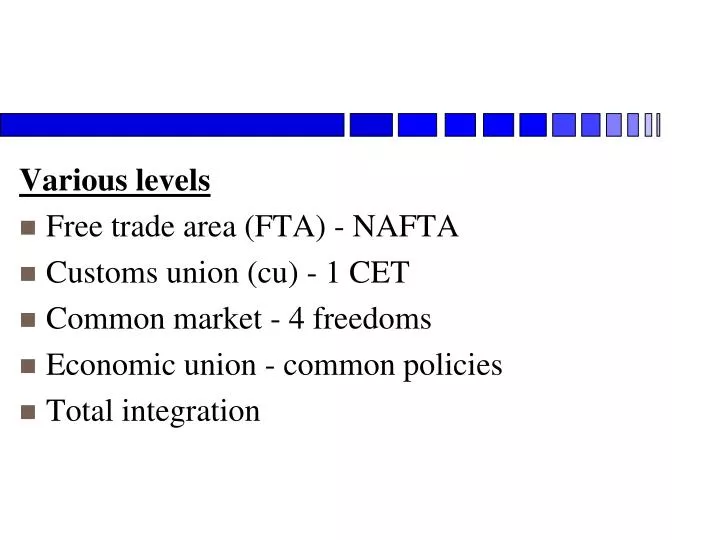
Various levels Free trade area (FTA) - NAFTA Customs union (cu) - 1 CET Common market - 4 freedoms Economic union - common policies Total integration. INTERNATIONAL ECONOMIC INTEGRATION REF:CU1A OCT 08.

E N D
Various levels • Free trade area (FTA) - NAFTA • Customs union (cu) - 1 CET • Common market - 4 freedoms • Economic union - common policies • Total integration
INTERNATIONAL ECONOMIC INTEGRATIONREF:CU1A OCT 08 Note: You will have a copy of these slides with spaces for you to complete during the lecture
Customs Unions • Trade creation / trade diversion • Dynamic effects • Terms of trade
Trade creation(TC) & Trade diversion(TD) • CU initially regarded as move to free trade • Viner (1950) : TC & TD • Numerical example
Numerical example Home Partner RoW • Price/cost (£) 50 40 30 • Case1: trade creation tariff= 30 • Pre cu • Post cu
Numerical example Home Partner RoW • Price/cost (£) 50 40 30 • Case1: trade creation tariff= 30 • Pre cu 50 70 60 • Post cu
Numerical example Home Partner RoW • Price/cost (£) 50 40 30 • Case1: trade creation tariff= 30 • Pre cu 50 70 60 • Post cu 50 40 60
Home Partner RoW • Price/cost (£) 50 40 30 • Case2: trade diversion tariff= 15 • Pre cu • Post cu
Home Partner RoW • Price/cost (£) 50 40 30 • Case2: trade diversion tariff= 15 • Pre cu 50 55 45 • Post cu
Home Partner RoW • Price/cost (£) 50 40 30 • Case2: trade diversion tariff= 15 • Pre cu 50 55 45 • Post cu 50 40 45
Assumptions (partial equilibrium analysis) • Partners (Sp) S/curve & world S/curve (Sw) infinitely elastic. Sw (efficient) below Sp • Domestic supply & demand (SH & DH) • Consumers don’t differentiate - origin of good • Home & partner small, CU small
CU theory note: model will differ if change assumptions Price Sp Sw DH SH Q good X
CU theory Price Phome Sp+tariff P2 Sw+tariff Sp P1 Sw DH SH Q good X
Pre CU Price Area abcd =? Phome Sp+tariff c b P2 Sw+tariff Sp P1 Sw d a DH SH Q1 Q2 Q good X
Post CU Price Phome Sp+tariff c b P2 Sw+tariff x y Sp P3 P1 Sw d a DH SH Q1 Q4 Q2 Q3 Q good X
Post CU Price Phome Sp+tariff c b P2 Sw+tariff x y W Sp P3 Z P1 Sw d a DH SH Q1 Q4 Q2 Q3 Q good X +ve specialisation effect +ve substitution effect
pre-cu post-cu PRICE P2 P3 CONSUMPTION Q1 Q3 PROD(home) Q2 Q4 IMPORTS Q1-Q2 Q3-Q4
Net gain = TC - TD x + y - z • production gain = x • consumer gain = y • cost of trade diversion = z • W = ?
Deductions • Higher original tariff - greater potential benefits • Smaller cost difference partner & RoW - likely TD losses lower • Greater price elasticity DH & SH - TC likely • Greater overlap of goods - bigger gains • Bigger CU - TD less likely • Low CET - TD less likely
Higher original tariff (compared to earlier diagram) - greater potential benefits Price TC > TD in this example P2 Sw+tariff x y Sp P3 Z P1 Sw DH SH Q4 Q3 Q2 Q1 Q good X
Remember: Previous diagram, showing TC<TD Price Phome Sp+tariff c b P2 Sw+tariff x y W Sp P3 Z P1 Sw d a DH SH Q1 Q4 Q2 Q3 Q good X +ve specialisation effect +ve substitution effect
Empirical evidence • Net result can’t be found from theory • empirical evidence (Nielsen) • Balassa - 3 studies 1953-1970 • TC > TD • Others agree • Truman (1968), Kreinin (1970), Aitkin (1970) • But: welfare = trade flows??
Measurement • counterfactual analysis • project trends • control country • trade flow models • Second best theory
Public goods argument for cu: Cooper & Massell (1965) & Johnson (1965) • Industrialisation • Bargaining strength • Pragmatic argument for free trade • Link with potential allies • Skilled labour pool • Reduce dependence on imports
Dynamic effects • Ignored in previous (static) analysis • Dynamic effects likely to result in major benefits • difficult to assess • orthodox CU theory concentrates on static benefits • can show welfare gains • consider redistribution to compensate losers
Dynamic effects • rise productivity • technological advances • concentration and market structures • economies of scale • economies of experience • Above limited to dynamic sectors; regional variations!!
Terms of Trade (ToT) effect • Important for a large CU • Improvement in ToT increases welfare • ToT - secondary objective • Any ToT gain transferred from rest of world - not wealth creating effect
Further developments • Common market theory • New trade theories • based on industrial organisation theory • Includes consideration of • market structures • competition effects • More recent research considers this • eg. Gasiorek, Smith, Venables, (JCMS 2002) consider the Uk’s entry into the EEC
Conclusion • CU theory only deals with the relatively small ‘static’ effects of integration, but it is a starting point • Empirical evidence from the formation of the EC6 seems to generally support CU theory • TC>TD


![AFTA [ASEAN Free Trade Area]](https://cdn2.slideserve.com/3979861/afta-asean-free-trade-area-dt.jpg)