
INTRODUCTION
The Use of Sports Sponsorships in Food Marketing Marie A. Bragg, MS; Rachel Sam, MPH; Christina A. Roberto, MS, MPhil ; Vishnu Sarda , MBBS, MPH; Jennifer L. Harris, MBA, PhD; Kelly Brownell , PhD Yale University. METHOD. ABSTRACT. Table 1. Index Ranking Organizations. CONCLUSIONS.

INTRODUCTION
E N D
Presentation Transcript
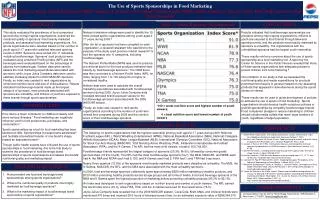
The Use of Sports Sponsorships in Food Marketing Marie A. Bragg, MS; Rachel Sam, MPH; Christina A. Roberto, MS, MPhil; Vishnu Sarda, MBBS, MPH; Jennifer L. Harris, MBA, PhD; Kelly Brownell, PhD Yale University METHOD ABSTRACT Table 1. Index Ranking Organizations CONCLUSIONS This study evaluated the prevalence of food companies’ sponsorship of major sports organizations, examined the nutritional quality of sponsors’ most heavily marketed products, and assessed food marketing expenditures. Ten sports organizations were selected based on the number of youth aged 2-17 years who watched televised sporting events in 2009. Sponsors were sorted into 11 industries, including food/beverage. Sponsors’ food products were evaluated using a Nutrient Profiling Index (NPI) and the beverages were evaluated based on the percentage of calories from added sugar. Nielson data were used to assess the food marketing expenditures associated with sponsors, while Joyce Julius Company data were used to estimate marketing impact for 2009 NASCAR sponsors. Finally, an index was created to rank organizations by combined nutrition score and size of child audience. Results indicated food/beverage brands made up the largest category of sponsors, most products associated with sponsors are unhealthy, and millions of youth are exposed to these brands through sports sponsorships. Nielson’s television ratings were used to identify the 10 most viewed sports organizations among youth aged 2-17 years during 2009.5 After the list of sponsors had been compiled for each organization, a research assistant who was blind to the purpose of the study used previous market research6to sort the sponsors into 11 categories, including food/beverages. The Nutrient Profile Model (NPM) was used to produce a nutritional score for the food products marketed most heavily by food/beverage sponsors.7The NPM score was then converted to a Nutrient Profile Index (NPI), an index ranging from 1 to 100 where 64 or higher is considered healthy. Nielsen data were used to calculate the overall marketing expenditures associated with food/beverage sponsors during 2009. Joyce Julius Company data revealed televised brand exposure values for the food/beverage sponsors associated with the 2009 NASCAR season. Finally, an index was created to rank sports organizations according to the number of youth who viewed their programs during 2009 and the nutrition score of their food/beverage sponsors. Results indicated that food/beverage sponsorships are prevalent among major sports organizations, millions of youth are exposed to food brands through televised sporting events, and the products most heavily marketed by sponsors is unhealthy. The organizations with the unhealthiest sponsors had the largest youth viewership. These results reinforce concerns about the use of sports sponsorship as a food marketing tool. A report by the Center for Science in the Public Interest revealed that many of these sports organizations lack adequate policies to protect children from food marketing.8 One limitation of our study is that we assessed the nutritional quality and media expenditures for products promoted most heavily in general instead of only assessing products that appeared in advertisements during the sports shows of interest. These results can be used to guide development of policies to address the use of sports in food marketing. Sports organizations should develop health-conscious policies or prohibit sponsorships by unhealthy food/beverage brands. Food companies’ pledges to reduce marketing to children should include media outlets that reach large numbers of youth, regardless of target population. INTRODUCTION *100 = worst nutrition score and highest number of youth viewers; 0 = best nutrition score and lowest number of youth viewers Poor diet is a major contributor to childhood obesity and some serious illnesses.1Food marketing can negatively influence youth’s food preferences, purchases, and consumption.2 Sports sponsorships as a tool for food marketing has been studied too little. Sponsorships increase brand awareness3and facilitate a beneficial transfer of one brand’s image toward an associated brand.4 Though public health experts have criticized the use of sports sponsorships in food marketing, this is the first study to examine the prevalence of food/beverage brand sponsorships of sports organizations and assess the brands’ nutritional quality and marketing impact. DATA ANALYSES AND RESULTS REFERENCES The following 10 sports organizations had the highest viewership among youth aged 2-17 years during 2009: National Football League (NFL), World Wrestling Entertainment (WWE), National Basketball Association (NBA), National Collegiate Athletic Association (NCAA), Major League Baseball (MLB), International Olympics Committee (IOC), National Association for Stock Car Auto Racing (NASCAR), Total Nonstop Action Wrestling (TNA), FédérationInternationale de Football Association(FIFA), and the X-Games. The NFL had the most child viewers, a total of 300,749,000. Food/beverage brands represented the largest category of sponsors (20.3%; N=30), followed by consumer goods sponsorships (16.4%; N=24). The NFL had the most food/beverage sponsors (N=7); the MLB, NASCAR, and WWE each had 4; the NBA and NCAA each had 3; IOC and X-Games each had 2; FIFA had 1; and TNA had 0 sponsors. Nearly three-quarters (72.9%) of the sponsors’ most heavily marketed products were classified as unhealthy. The MLB, the X-Games, NASCAR, the NFL, and the NBA were associated with the most unhealthy sponsors. In 2009, food and beverage sponsors collectively spent approximately $929 million marketing unhealthy products, and $123 million promoting healthy products across all age groups and all forms of media. Food and beverage sponsors of the NBA and X Games spent the highest proportion of marketing dollars promoting unhealthy products (93.3% to 92.1%). An index was developed to rank organizations based on nutrition scores and number of youth viewers. The NFL earned the worst index score (91.0), while FIFA, TNA, and the X-Games were tied for the lowest score (75.0). Joyce Julius Company data revealed that in the 2009 NASCAR season, Coca-Cola, Kraft, Mars, and Unilever brands were mentioned 470 times and received 28.5 hours of televised screen time, for an estimated exposure value of $286,364,070. • 1. World Health Organization. Diet and physical activity: a public health priority. http:// ho.int/dietphysicalactivity/en/index.html. Accessed October 7, 2010. • 2. McGinnis JM, Gootman JA, Kraak VI, eds. Food marketing to children and youth: threat or opportunity? Washington, D.C.: National Academies Press, 2006. • 3. CuneenJ, Hannan M. (1993). Intermediate measures and recognition testing of sponsorship adverting at an LPGA tournament. Sport Marketing Quarterly, 2(1), 47-56. • 4. GwinnerKP, Eaton, J. Building brand image through event sponsorship: The role of image transfer. J Adver 1999;28:47-57. • 5. Nielsen Company: 2009 television program rankings among ages 2-11, 12-17, and 18-49 years. Available from: http://www.nielsen.com/ • 6. Cornwell TB, Roy DP, Steinard EA. (2001). Exploring Managers' Perceptions of the Impact of Sponsorship on Brand Equity. J Advert, 30(2), 41-51. • 7. RaynerM, Scarborough P, Boxer A, Stockley L. Nutrient Profiles: Development of Final Model. December 2005. (Accessed February 4, 2011 at http://www.food.gov.uk/ multimedia/pdfs/nutprofr.pdf.) • 8. Center for Science in the Public Interest. Report card on food-marketing policies: An • analysis of food and entertainment company policies regarding food and beverage • marketing to children. Washington, D.C.: Center for Science in the Public Interest, • March 2010. (Accessed April 1, 2011, at • http://cspinet.org/new/pdf/marketingreportcard.pdf.) RESEARCH QUESTIONS How prevalent are food and beverage brand sponsorships among sports organizations? What is the nutritional quality of products most highly marketed by food/beverage sponsors? What is the marketing impact of food/beverage brand sponsorship of sports organizations? CORRESPONDENCE Correspondence may be sent to: Marie Bragg, Rudd Center, 309 Edwards st, New Haven, CT 06511; Marie.Bragg@yale.edu


