Download

1 / 23
230 likes | 333 Vues
The relative importance of supply and demand factors in determining preschool attendance. Rob Wassmer , Chairperson and Professor, Public Policy and Administration, Sacramento State. Summary. Introduction Literature Review Regression Model Data Description Regression Results

E N D
The relative importance of supply and demand factors in determining preschool attendance Rob Wassmer, Chairperson and Professor, Public Policy and Administration, Sacramento State
Summary • Introduction • Literature Review • Regression Model • Data Description • Regression Results • Policy Implications • Conclusion
Introduction • … But today, fewer than 3 in 10 four year-olds are enrolled in a high-quality preschool program. Most middle-class parents can’t afford a few hundred bucks a week for a private preschool. And for poor kids who need help the most, this lack of access to preschool education can shadow them for the rest of their lives. So tonight, I propose working with states to make high-quality preschool available to every single child in America… • (President Obama’s State of the Union Address, 2/12/2013)
Introduction http://greatergreatereducation.org/post/18902/daycare-is-education-part-2-early-childhood-care-matters
Introduction For 2009; http://earlyed.newamerica.net/blogposts/2010/2009_snapshot_of_preschool_programs_state_by_state_shows_losses_and_gains-31358
Introduction • All programs analyzed were high quality • Proposed is universal, analyzed programs were targeted to low-income and disadvantaged Lynch, R. G. (2004). Exceptional Returns: Economic, Fiscal, and Social Benefits of Investment in Early Childhood Development. Washington, DC: Economic Policy Institute
Introduction • From CHIS survey data used here • Mimics what found elsewhere • Latino Difference • Income Difference Figure 1: Preschool Attendance for 10 or more Hours a Week for Californians Aged 3-5 in 2011-12 (From California Health Interview Survey; 95 Percent Confidence Interval in Parentheses)
Introduction • Strong Start for Children Act • November 2013, multi-year $100B federal subsidies for high quality state preschool programs • Serve three- to five-year-olds, teachers hold Bachelor’s degrees, maximum class size, specific staff to student ratio, full-day, curriculum aligned with state standards, pay in line with K-12, regular state monitoring, comprehensive services offered, teacher professional development, meet Head Start standards, and health/safety standards. • California State Assembly commissioned this study
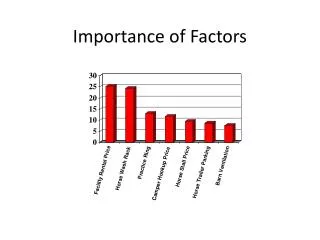
Literature Review • Economic model of parent(s)’ demand for child’s preschool education and available supply determining observed attendance • Table A1 offers summary of previous regression studies • Demand factors • Income • Clearly a normal good • Substitute availability • Greater use if grandparent not available, mother/father/partner not present • Preferences • Race/ethnicity, English proficiency, employment, maternal education • Supply of providers (price) • None did an adequate job of accounting for this • Greater use if lower average tuition price in county, preschool statewide funding, urban residence
Regression Model • Preschool Hoursi = f(Incomei, Substitute Availabilityi, Preferencesi, Supply of Providersi, Controlsi) • Where i = 1, 2, 3, …1,928 households with children aged three to five in CHIS survey • Preschool Hoursi = f(Incomei, Familyi, Parentsi, Race/Ethnicityi, Childi, Neighborhoodi, Child Care Facilitiesi)
Data Description • June 2011 to Jan 2013 telephone survey of 7,344 CA households containing newborns to age 18 • Data from 1,928 respondents with child age 3-5 • Questions used • Regular childcare of more than 10 hours a week in private preschool/nursery school or public Head Start/state preschool (yes for 499) • Number of hours in an average week last year • Survey weights used
Regression Results • Use STATA Two-Part Model (TPM) • Logistic regression • One for 499 respondents, zero for 1,429 respondents • OLS • Typical weekly hours in preschool for 499 respondents (mean=28.5) • Robust standard errors (heteroskedasticity and survey weights) • Also calculate conditional marginal effects at mean values for all statistically significant influences on overall preschool hours (comparable to Tobit) • Table 2 • Four sets of Logit/OLS results with (1) no provider measure, (2) providers within 5 miles, (3) providers within 10 miles, (4) providers within 20 miles • Only show (4)
Table 2: Logit (Preschool Attend or Not) and OLS (Preschool Hours Attended) Regression Results for Various Measures of Provider Availability (estimated with STATA Two-Part Model) 1Excluded category is More than Three Times Poverty Line; 2Excluded category is Less than High School; 3 Excluded category is Primary Caregiver Less than Age 30; 4Excluded category is White; 5Excluded category is Child Age Six; 6Excluded category is Urban.
Table 3: Provider Interaction Results (Other Explanatory Variables Included but Results not Recorded)
Table 4: Conditional Marginal Effects Calculated at Mean Values for all Statistically Significant Influences on Overall Value Preschool Hours (from a mean of 7.387) ~Derived using STATA’s margins, dy/dx atmean command. These indicate the expected change in hours of preschool attended for a one-unit change in the respective variable, holding all other explanatory variables constant.
Policy Implications • Different demand and supply influences found important to parent(s)’ decision to (1) send child to preschool and (2) hours to attend • Demand factors and attendance • 50% greater: Household income > three times federal poverty level • 70% smaller: MKA does not speak English • 80% smaller: MKA believes neighborhood people not helpful • 150 to 500% greater: MKA holds Bachelor’s to doctorate degree • 200 and 400% greater: African and Native American compared to White • Latino affect disappears • Above findings could help guide outreach/subsidy efforts
Policy Implications • Demand factors and hours (mean = 28.5) attended • 4.0 hours less: Asian • 4.5 hours more: Own home • 5 hours less: Married (as compared to unmarried) parents • 5.5 hours less: Age 30 to 39 (as compared to less than age 30) • Above findings could help guide outreach/subsidy efforts • Note cumulative affect of being Asian, renting, married and age 30 to 39 is 19 hours less
Policy Implications • Supply factors and attendance • 40% smaller: Suburban (as compared to urban) residence • Supply of preschool slots per 3-5 year olds within • 10 mile radius is 0.165 • 20 mile radius is 0.177 • Raise supply of preschool slots one standard deviation (0.06) • Within 10 mile radius, increase likelihood of attendance by 75% • Within 20 miles radius, increases likelihood of attendance by 300% • Supply of preschool slots influence nearly as great as education influences noted earlier
Policy Implications • Supply factors and hours (mean = 28.5) attended • Only detected when preschool slots per 3-5 year olds interacted with type of residence • Consider findings for provider measure within 20 miles • Suburban (as compared to urban) attends13.8 less hours • Town/Rural (as compared to urban) attends18.3 less hours • These hours increase based upon preschool slots per 3-5 year old in Town/Rural area • If minimum of 0.017 then 0.63 more • If mean of 0.177 then 6.58 more • If maximum of 0.319 then 11.86 more • But never enough to overcome Town/Rural deficit
Conclusion • Public policy interventions designed to increase preschool attendance should not only target outreach/subsidies at the groups identified here, but also consider ways to increase providers in areas with low preschools slots per 3-5 year olds • More public and Head Start providers • Public subsidies to private providers • Reducing zoning codes previously found to negatively influence presence of providers (Queralt and Witte, 1998)