Download
1 / 42
420 likes | 445 Vues
Learn about the Oceanic Fisheries Programme's strategic goals, key achievements, and future challenges in managing tuna and related species sustainably. Explore the main funding sources, client-based services, and projects for advancing scientific advice and data management.

E N D
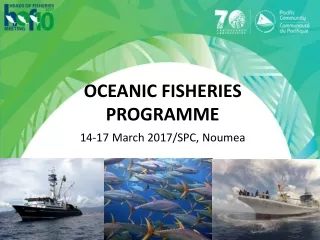
OCEANIC FISHERIES PROGRAMME 14-17 March 2017/SPC, Noumea
Oceanic Fisheries Programme OFP Goal (FAME Strategic Plan 2013-2016) “Fisheries exploiting the region’s resources of tuna, billfish and related species are managed for economic and ecological sustainability using the best available scientific information”
Oceanic Fisheries Programme • Client-based scientific service delivery • SPC members • FFA and sub-regional groups • WCPFC • Capacity building a major cross-cutting theme • 2017 projected budget approximately 11.6 million CFP units
Donor Partners Thank you for your support! • Australia • Environmental Defence Fund • European Union • FAO (ABNJ) • FFA – Regional Observer Cost Recovery • Global Environment Facility • International Seafood Sustainability Foundation • IUCN • Korea • New Zealand • Pew Charitable Trusts • The Nature Conservancy • WCPFC • WWF
Stock assessment and modelling 14-17 March 2017/SPC, Noumea
Overview • Reminder – what does SAM do? • Key stories from 2015-2016 • Lessons learnt • What next? 2017 onwards… • Key challenges Supporting national, sub-regional and regional management decisions through world-class scientific advice
Regional stock assessments for tuna and tuna-like species undertaken Scientific advice for subregional fisheries management initiatives Capacity built and communication improved Scientific advice for national fisheries management initiatives
2016 skipjack stock assessment • Most robust SKJ assessment ever • Examined key uncertainties • Robustly defended the science at WCPFC SC12 from key DWFN criticisms • Comprehensively responded to criticisms through further analyses to WCPFC13
National policy support • Longline bio-economic analyses & Fisheries Management Plans • In collaboration with FFA • HoF agenda item, WP4
National policy support • National webpages • >60 national reports in 2016 • FAD reports • Spatial fishing reports • National bycatch reports
Lessons learned • Increased focus on harvest strategies • National/sub-regional/regional • Increased ‘capacity building’ • Calls for more advanced workshops • Improved gender balance • Increased call for bio-economic analyses
What next? 2017 onwards • Harvest strategies • Working with managers to define ‘target’ levels • New tropical tuna CMM + new assessments • Increase understanding of FADs • Win-win options for BET mitigation • New management options • Improved management of longline fisheries • National bio-economic analyses • Management options for SPA • Enhanced capacity building • CMM effectiveness
Key challenges • Supporting harvest strategy development • Biggest tuna fishery in the world • Diversity in national objectives within the WCPO • Gaining agreement at the international level • New data requirements • E.g. economics/social
Supporting national, sub-regional and regional management decisions through world-class scientific advice • Waiting for your call
DATA MANAGEMENT 14-17 March 2017/SPC, Noumea
Data Management Main highlights / achievements (2015-2016) Lessons learned Future (what next ?) Challenges…
Data Management ServicesData acquisition, management and disseminationSystems, tools and support servicesCapacity development Data Management – what do we do ? MEMBER COUNTRIES Regional & sub-regional fisheries agencies (WCPFC, FFA, PNAO) OFP Scientists
Main highlights – 2015/2016 New • TUFMAN 2 • TUFMAN 1 replacement, cutting-edge • Logsheet, port sampling, unloadings, artisanal … • Web-based via browser (Secured !) • Installed in 16 PICTs including training • Data shared according to rules • Immediate access to processed data with internet • Accepts E-Reported data (e.g. iFIMS elog) • State-of-art helpdesk - SLACK
Main highlights – 2015/2016 New • DORADO(web-reporting system) • >100 reports using TUFMAN 2 and observer data • Satisfying national and WCPFC reporting reqs. • Access anywhere through secure login • Tables, Graphs, Maps • Different data source comparisons
Main highlights – 2015/2016 New • TAILS • Mobile device app (Google play store) • Allows remote data entry (in the field) • Artisanal: Logsheets, vessel activity/registration • Integrated with TUFMAN 2 and DORADO • Enter data offline, upload later… • Port sampling currently under development
Data Management Other highlights/achievements HoF10 papers Information Papers IP3 & IP4
Data Management Lessons learned • Setting regional standards • … make it easier to acquire, manage and disseminate data (e.g. DCC, WCPFC ER stds) • Consideration of what is important for member countries • e.g. being flexible to respond to differing requirements • Keeping up with technology • Continual process • Life span of DB tools • More powerful platforms become available • Takes time and resources … but worth the investment …
Data Management Future • TUFMAN 2 for observer data (major development project) • OnBoard • new E-Log mobile device app for SPAC Longline fishery integrating with TUFMAN 2 • Enhanced CAPACITY DEVELOPMENT • Data Auditing and Data Management • New Systems ! • CDS/CMS/TKA initiatives in SPAC LL fishery - collaboration with FFA & member countries • Enhanced reporting tools • New CES and mobile device push reports – better data dissemination to senior managers • Standing commitments and ongoing support to key clients • e.g. PICTs, WCPFC Data Manager, OFP Scientists, FFA, PNAO
Data Management Key challenges • New technologies (e.g. ER and EM) • Changing fast … need to be innovative but flexible … continuous redevelopment of products …. listen/respond to countries requirements … will still need people, but transition of roles … ensuring standards for 3rd party technical service providers • Integration of different IMS products • TUFMAN 2 / FIMS / RIMF / CDS etc. • Dealing with different and non-standard requirements • Respond to directives issued by countries… • Different systems can exist, but ensure data flows seamlessly to the benefit of PICTs • Cooperation and Collaboration ! • Data sharing rules and regional standards are important !
Data Management – Take home message E-Reporting and E-Monitoring Enhanced DATA ACCESS (data sharing rules and inter-IMS data flows) • YOUR DATA • Better quality • More timely • More accessible • More efficient • More cost effective Enhanced DATA QUALITY and COVERAGE through reports and targeted auditing Data summaries, incl. RECONCILING different types of data (DORADO web reporting) Enhanced training techniques and tools to BUILD CAPACITY
FISHERIES AND ECOSYSTEMS MONITORING AND ANALYSIS 14-17 March 2017/SPC, Noumea
Overview Integrated monitoring has just begun – it is entirely driven by current and future needs of our members The new FEMA section Key stories 2015-2016 Lessons learnt What next? 2017 onwards… Key challenges
New FEMA • Previously two sections: • Fisheries Monitoring section • Ecosystem Monitoring and Analysis section • Began merge late 2015 • Completed early 2016 • Covers all previous work + now includes e-monitoring
EVEN BETTER SCIENCE BETTER SCIENCE Data (Effort, catch, ecosystem, biology) Data (Effort, catch, biology) Additional biological and ecosystem research Better fisheries and ecosystem monitoring Additional biological research Better fisheries monitoring Stock Assessments Stock Assessments Ecological indicators Uncertainties Uncertainties Uncertainties Uncertainties Reduced uncertainty Management Advice Management Advice EVEN BETTER FISHERIES BETTER FISHERIES
Key stories: observers • Developing and refining regional standards (PIRFO) • Quality assurance of training and data • National ownership helps create local jobs (at-sea and onshore) • Gender modules • Cost recovery
Key stories: tagging Central Pacific cruise 2015 tagged 1953 bigeye tuna Western Pacific cruise 2016 tagged 1575 bigeye tuna Collected broad range of data on all species encountered - acoustic and archival tags, biological specimens Critical stock assessment input Key international and sector collaborations along with national support
Key stories: e-monitoring • A technology development driven by members • Developed standards for process to transform records to data for LL, and for office observers (PIRFO) • Trials in Solomon Islands, New Caledonia, Fiji, Palau, FSM and RMI • Integrating with DM section e.g. OnBoard
Key stories: turtles • (New) use of regional data • Access to new data • Capacity building • New ways of working • Ocean basin scale • Immediate management application
Lessons learnt Using lmax as an ecosystem indicator Length (cm) Figure 1: Yellowfin catch length frequency derived from observer sampling data, 1985. • External interest in region as global sentinel • Better use of existing assets • Scale • Integration of monitoring is critical
What next? 2017 onwards • Market driven ecosystem science • Bycatch science (MSC) • Climate change and ocean acidification • Genetics (traceability, CDS) • Integrated monitoring – including e2 • Regional standards with member implementation • Monitoring collects fisheries and ecosystem data • Increasing range of data stored here for you • Integrated analyses
Key challenges • Significantly enhancing regional science capability with key assets • marine tissue bank • tagging platform • high speed computing/internet bandwidth • Attracting investment at a regional scale • Providing advice from a regional context in a scale which is nationally actionable • data limitations, population base, regional scale
Summary Integrated monitoring has just begun – it is entirely driven by current and future needs of our members Need to invest soon if we want to keep markets open Monitoring is still science Integrated approaches critical for success