
Impact of Fluoxetine and Acetaminophen on Xenopus Development
Investigating sub-chronic effects of fluoxetine and acetaminophen on Xenopus laevis tadpoles, exploring pharmaceutical impact on amphibian larvae development in a controlled experiment setup.

Impact of Fluoxetine and Acetaminophen on Xenopus Development
E N D
Presentation Transcript
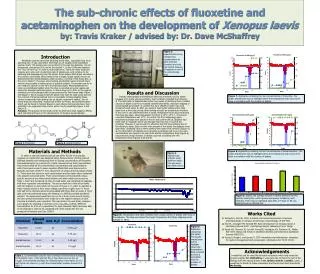
The sub-chronic effects of fluoxetine and acetaminophen on the development of Xenopus laevisby: Travis Kraker / advised by: Dr. Dave McShaffrey Figure 3. Experimental set-up. Contains two concentrations of each chemical (random) and only one control because all tadpoles in one of the control tanks died. Introduction Amphibian species have been declining world-wide , especially frogs at an alarming rate. It was reported in 2004 that out of roughly 6,300 amphibian species nearly 170 species have gone extinct in the past two decades, 1/3 are threatened and almost 50% are on the decline 3. In fact 2008 was declared the “Year of the Frog” in order to raise awareness. There are many proposed reasons as to why such an alarming rate of species are, and continue to be, declining and disappearing from the planet. Some believe that global warming is the primary cause while others believe that a deadly fungal species known as Batrachochytrium dendrobatidus, which causes a covering of the frog’s skin,is the one to blame 4. However, when looking at potential human impacts there may be one possible or rather group of possible culprits. The answer may lie in our medicine cabinets in the form of pharmaceuticals. Pharmaceuticals can enter an amphibians habitat when the drug is excreted as human waste and enters the sewage treatment system. In some drugs up to 92% of the original chemical can be unchanged after being processed by the human body. Figure 1 and Figure 2. Since sewage treatment plants only treat for solid waste and not the removal of pharmaceuticals there is essentially nothing stopping these various compounds from getting into an aquatic organism’s habitat. Two of these drugs are fluoxetine, respectively known as Prozac, and acetaminophen which can be found in Tylenol. Based on each drug’s chemical structure, their solubility in an organisms body and in water may be predicted (Figure 1 and Figure 2). Purpose: The purpose of this study will be to determine what negative effects each chemical will have on the development of Xenopuslaevistadpoles. Works Cited 1. Richards S, Cole SE. 2006.A toxicity and hazard assessment of fourteen pharmaceuticals to Xenopuslaevis larvae. Ecotoxicology 15:647-656. 2. Sive HL, Grainger RM, Harland RM. Early Development of Xenopuslaevis: A Laboratory Manual 2002. Cold Springs Harbor Laboratory Press: 344pp. 3. Stuart SN, Chanson JS, Cox NA, Young BE, Rodriguez AS, Fischman DL, Waller RW. 2004. Status and trends of amphibian declines and extinctions worldwide. Science 306(5702). 4. Young S, Berger L and Speare R. 2007. Amphibian chytridiomycosis: strategies for captive management and conservation. Internation Zoo Yb 45: 85-95. Results and Discussion Results varied greatly and statistical data was extremely hard to obtain because of so many varying problems. Such problems included the following: 1. The first batch of tadpoles died within two weeks of obtaining them. Possible sources of death could have included contaminated tanks, improper shipping or contaminated pond water. To combat this error UltraPure water was used instead of pond water. 2. After one week of rearing the tadpoles then died again over a three day period. After looking at basic air temperature monitors in the room it was determined that a drastic temperature drop occurred during this three day span. Ideal temperature for them is 18°C -25°C 2. The lowest recorded temperature was 12°C. To combat this from happening again temperature probes were placed in the air and control tank 3. Tadpoles had been seen to “explode” and it was thought that this was a result of the chemical. However, it was brought to attention that this was probably due to the UltraPure water. Since no ions were present in the water, the tadpoles more than likely “exploded” due to them swelling with water from osmosis (Figure 4). 4. The third batch of tadpoles were growing accordingly and a curve for each concentration was begun to be seen until another temperature drop (Figure 6) occurred and a large increase in deaths occurred coinciding with the temperature drop (Figures 6,7,8 and 9). Figure 5. Temperature drop that coincided with a large number of deaths with most of the tadpoles. This drop was below the lowest temperature that these tadpoles could tolerate (> 18°C). Figure 1.Fluoxetine Figure 2. Acetaminophen Materials and Methods • In order to see how pharmaceuticals can affect the life of an aquatic organism an experiment was designed using Xenopuslaevis (African-clawed bullfrog) tadpoles and introducing them to varying concentrations of fluoxetine and acetaminophen in a microcosm / static-renewal set-up. Each concentration was chosen based off of environmental concentrations and concentrations which have been known to cause negative effects that were discovered by Richards and Cole (2004)1 in their assessment of certain pharmaceuticals (Table 1). There were two tanks for each concentration and two tanks which contained only tadpoles and pond water. These concentrations were prepared using a specific amount of pre-mixed stock solution and water which can be seen in Table 1. Each tank contained six liters of pond water and contained ten tadpoles with their respective concentrations. The set-up made for a total of ten tanks with ten tadpoles in each which can be seen in Figure 3. In order to maintain a static-renewal system a 50% water change was done roughly every 72 hours with half of the chemical amount being added with three liters of water. A 12/12 light cycle was performed along with feeding of a NASCO provided powdered nutrient. The experiment would then be run for a three month period. During this time period observations were made as to the negative impacts of each chemical and deaths were recorded. This was done to try and obtain response curve graph. By obtaining a response curve a LC50/EC50 (Lethal / Effective Concentration for 50% of a population) for each chemical might have been able to be obtained in order to be compared with other articles like the one produced by Richards and Cole (2004)1 . Figure 7. Replicates containing the two concentrations of fluoxetine. The purple shaded area was to highlight where the temperature drop occurred to show a correlation with the number of deaths. Figure 9. Depicts the average amount of deaths between the two replictes among the control groups and groups containing each chemical. There was no statistical data after a P-value of .85 was obtained from an ANOVA test. Figure 6. Replicates containing just water. The purple shaded area was to highlight where the temperature drop occurred to show a correlation with the number of deaths. Figure 4. Tadpole’s gut contents using UltraPure water. This was more than likely due to osmosis. Figure 8. Replicates containing the two concentrations of acetaminophen. The purple shaded area was to highlight where the temperature drop occurred to show a correlation with the number of deaths. Acknowledgements I would first and for most like to thank my advisor who’s help made this project possible: Dr. McShaffrey. I would also like to thank the rest of the Biology staff with special thanks to Dr. Spilatro and Dr. Lustafin. Lastly ,I would like to thank my fellow classmates and friends and most importantly My Family. Table 1. Concentrations used for each chemical. Environmental averages for fluoxetine were 0.018 µg/l but EC50’s have been seen as low as 0.1µg/l. Environmental averages for acetaminophen were higher at 0.11 µg/l but do not show LC50’s until the concentration reaches around 13.3 mg/l. 1


