Download

1 / 21
220 likes | 315 Vues
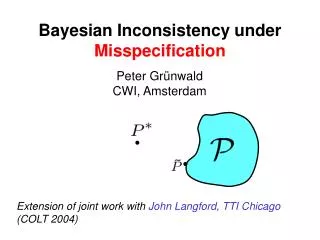
This study explores Logistic Positive Exponent (LPE) models as a potential source of model misspecification in vertical scaling using real data from the Wisconsin Knowledge and Concepts Examination. The implications of LPE-related misspecification are evaluated through simulation studies, comparing LPE to Traditional IRT models. The results suggest that understanding the complexity of items across grade levels is crucial for accurate scaling and growth assessment.

E N D
IRT Model Misspecification and Metric Consequences Sora Lee Sien Deng Daniel Bolt Dept of Educational Psychology University of Wisconsin, Madison
Overview • The application of IRT methods to construct vertical scales commonly suggests a decline in the mean and variance of growth as grade level increases (Tong & Kolen, 2006) • This result seems related to the problem of “scale shrinkage” discussed in the 80’s and 90’s (Yen, 1985; Camilli, Yamamoto & Wang, 1993) • Understanding this issue is of practical importance with the increasing use of growth metrics for evaluating teachers/schools (Ballou, 2009).
Purpose of this Study • To examine logistic positive exponent (LPE) models as a possible source of model misspecification in vertical scaling using real data • To evaluate the metric implications of LPE-related misspecification by simulation
Data Structure (WKCE 2011) • Item responses for students across two consecutive years (only including students that advanced one grade across years) • 46 multiple-choice items each year, all scored 0/1 • Sample sizes > 57,000 for each grade level • Grade levels 3-8
Wisconsin Knowledge and Concepts Examination (WCKE) Math Scores 2010-2011, Grades 4-8
Samejima’s 2PL Logistic Positive Exponent (2PL-LPE) Model The probability of successful execution of each subprocessg for an item i is modeled according to a 2PL model: while the overall probability of a correct response to the item is and ξ > 0 is an acceleration parameter representing the complexity of the item.
Samejima’s 3PL Logistic Positive Exponent (3PL-LPE) Model The probability of successful execution of each subprocessg for an item i is modeled according to a 2PL model: while the overall probability of a correct response to the item incorporates a pseudo-guessing parameter: and ξ > 0 is an acceleration parameter representing the complexity of the item.
Effect of Acceleration Parameter on ICC (a=1.0, b=0)
Item characteristic curves for an LPE item (a=.76, b=-3.62, ξ=8) when approximated by 2PL
Analysis of WKCE Data: Deviance Information Criteria (DIC) Comparing LPE to Traditional IRT Models
Example 2PL-LPE Item Parameter Estimates and Standard Errors (WKCE 8th Grade)
Item Characteristic Curves of 2PL and 2PL-LPE (WKCE 7th Grade)
Item Characteristic Curves of 3PL and 3PL-LPE (WKCE 7th Grade)
Goodness-of-Fit Testing for 2PL model (WKCE 6th Grade Example Items)
Simulation Studies • Study 1: Study of 2PL and 3PL misspecification (with LPE generated data) across groups • Study 2: Hypothetical 2PL- and 3PL-based vertical scaling with LPE generated data
Study 1 • Purpose: • The simulation study examines the extent to which the ‘shrinkage phenomenon' may be due to the LPE-induced misspecification by ignoring the item complexity on the IRT metric. • Method: • Item responses are generated from both the 2PL- and 3PL-LPE models, but are fit by the corresponding 2PL and 3PL IRT models. • All parameters in the models are estimated using Bayesian estimation methods in WinBUGS14. • The magnitude of the ϴ estimate increase against true ϴ change were quantified to evaluate scale shrinkage.
Results, Study 1 • 2PL • 3PL
Study 2 • Simulated IRT vertical equating study, Grades 3-8 • We assume 46 unique items at each grade level, and an additional 10 items common across successive grades for linking • Data are simulated as unidimensional across all grade levels • We assume a mean theta change of 0.5 and 1.0 across all successive grades; at Grade 3, θ ~ Normal (0,1) • All items are simulated from LPE, linking items simulated like those of the lower grade level • Successive grades are linked using Stocking & Lord’s method (as implemented using the R routine Plink, Weeks, 2007)
Results, Study 2 Table: Mean Estimated Stocking & Lord (1980) Linking Parameters across 20 Replications, Simulation Study 2
Results, Study 2 Figure: True and Estimated Growth By Grade, Simulation Study 2
Conclusions and Future Directions • Diminished growth across grade levels may be a model misspecification problem unrelated to test multidimensionality • Use of Samejima’s LPE to account for changes in item complexity across grade levels may provide a more realistic account of growth • Challenge: Estimation of LPE is difficult due to confounding accounts of difficulty provided by the LPE item difficulty and acceleration parameters.