Download
1 / 38
380 likes | 416 Vues
Explore the use of near infrared spectroscopy for monitoring chemical and sensory parameters of tomato products. Detailed methodology, results, and conclusions presented. University lecturer from Catalonia shares insights.

E N D
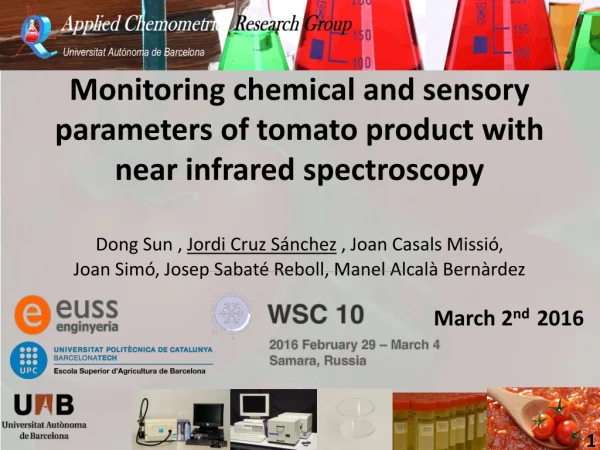
Monitoring chemical and sensory parameters of tomato product with near infrared spectroscopy Dong Sun, Jordi Cruz Sánchez, Joan CasalsMissió, Joan Simó, Josep Sabaté Reboll, ManelAlcalàBernàrdez March 2nd 2016
Whoam I? 1. INTRODUCTION 2. OBJECTIVES 3. METHODOLOGY 4. RESULTS 5.CONCLUSIONS Jordi Cruz University lecturer from Escola UniversitàriaSalesiana de Sarrià and external researcher in Applied Chemometrics Group at UniversitatAutònoma de Barcelona
Where I comefrom? 1. INTRODUCTION 2. OBJECTIVES 3. METHODOLOGY 4. RESULTS 5.CONCLUSIONS CATALUNYA a country that sees how the sun rises from the Mediterranean Sea
Where I comefrom? 1. INTRODUCTION 2. OBJECTIVES 3. METHODOLOGY 4. RESULTS 5.CONCLUSIONS I come from CATALUNYA
Where I comefrom? 1. INTRODUCTION 2. OBJECTIVES 3. METHODOLOGY 4. RESULTS 5.CONCLUSIONS CATALUNYA is country of ancestral traditions
Where I comefrom? 1. INTRODUCTION 2. OBJECTIVES 3. METHODOLOGY 4. RESULTS 5.CONCLUSIONS CATALUNYA is a country of gastronomy.
Pa amb tomàquet 1. INTRODUCTION 2. OBJECTIVES 3. METHODOLOGY 4. RESULTS 5.CONCLUSIONS Best tomato quality must be chosen CATALUNYA’s most known recipe.
Quality control 1. INTRODUCTION 2. OBJECTIVES 3. METHODOLOGY 4. RESULTS 5.CONCLUSIONS Control Parameters Chemical Sensorial Fructose Glucose Brix Dry matter Sweetness Acidity Flavor Explosiveness Aroma Crispiness Floury Skin perception
Quality control 1. INTRODUCTION 2. OBJECTIVES 3. METHODOLOGY 4. RESULTS 5.CONCLUSIONS Chemical methods Tasting panel TRADITIONAL METHODOLOGIES • Time, Money & chemical reagents consuming • Sample preparation • For sensory methods a tasting panel is needed
No sample preparation • Many modes of measuring • Low cost analysis • Fast • Robust • Nondestructive 1. INTRODUCTION 2. OBJECTIVES 3. METHODOLOGY 4. RESULTS 5.CONCLUSIONS WHY NIR? Chemical & Physical & other Information Multi parametric analisys
1. INTRODUCTION 2. OBJECTIVES 3. METHODOLOGY 4. RESULTS 5.CONCLUSIONS OBJECTIVES • Determination of physical, chemical and sensorial parameters in ripe tomatoes • Development of fast analytical methodologies • Demonstrate that NIR spectroscopy combined with spectral pretreatment, Partial Component Analysis, and Partial Least Squares Regression can be an alternative technique to classical and sensorial analysis
1. INTRODUCTION 2. OBJECTIVES 3. METHODOLOGY 4. RESULTS 5.CONCLUSIONS TOMATO SAMPLES LIQUID EXTRACT • PURÉE There were 316 juice samples and 270 puree samples in total. Flesh, seeds, and peels were extracted from purée Crushed tomatoes
1. INTRODUCTION 2. OBJECTIVES 3. METHODOLOGY 4. RESULTS 5.CONCLUSIONS NEAR INFRARED APPLICATION NIR SPECTROSCOPY TRANSFLECTANCE REFLECTANCE LIQUID EXTRACT • PURÉE
1. INTRODUCTION 2. OBJECTIVES 3. METHODOLOGY 4. RESULTS 5.CONCLUSIONS Workflow of model development Data structure • Data set split • Spectra pretreatment • Spectral range selection • Outlier selection • Calibration • Validation 1100-2500 nm Sensorial Parameters Chemical Parameters SAMPLES NIR SPECTRA 4 7 699
1. INTRODUCTION 2. OBJECTIVES 3. METHODOLOGY 4. RESULTS 5.CONCLUSIONS Spectra pretreatment Absorbance Absorbance Wavelength (nm.) Wavelength (nm.) a) Tomato liquid extract b) Tomato purée
1. INTRODUCTION 2. OBJECTIVES 3. METHODOLOGY 4. RESULTS 5.CONCLUSIONS Pretreated Tomato liquid extract spectra Absorbance Absorbance Absorbance Wavelength (nm.) Wavelength (nm.) Wavelength (nm.) SG smth+ 1stDer MSC +1st Der SG smth+ 2nd Der • Pretreated Tomato purée spectra Absorbance Absorbance Absorbance Wavelength (nm.) Wavelength (nm.) Wavelength (nm.) SG smth+ 1stDer MSC +1st Der SG smth+ 2nd Der
1. INTRODUCTION 2. OBJECTIVES 3. METHODOLOGY 4. RESULTS 5.CONCLUSIONS Tomato liquid extract models
1. INTRODUCTION 2. OBJECTIVES 3. METHODOLOGY 4. RESULTS 5.CONCLUSIONS Fructose (g/l) 7 PLS components Range :1100-1834nm,2120-2320nm Pretreatment: SG 2D 11points 2order Calibration range: 4,52-15,14(g/L) RMSEC=0,41 g/l Prediction range: 4,77- 14,98(g/L) RMSEP=0,52 g/l Calibration Prediction
1. INTRODUCTION 2. OBJECTIVES 3. METHODOLOGY 4. RESULTS 5.CONCLUSIONS Glucose (g/l) 7 PLS components Range :1100-1834nm, 2120-2320nm Pretreatment: SG 2D 11points 2order Calibration range: 2,43-15,47(g/L) RMSEC=0,48 g/l Prediction range: 4,40- 14,26(g/L) RMSEP=0,51 g/l Calibration Prediction
1. INTRODUCTION 2. OBJECTIVES 3. METHODOLOGY 4. RESULTS 5.CONCLUSIONS Tomato purée models
1. INTRODUCTION 2. OBJECTIVES 3. METHODOLOGY 4. RESULTS 5.CONCLUSIONS Fructose (g fructose/l ) 3 PLS components Band Range :1100-1850nm,2094-2238nm Pretreatment: SG 2D 11points 2order Calibration range: 0,67-3,82(g/100g) RMSEC=0,13g/100g Prediction range:1,38-3,52 g/100g RMSEP=0,08 g/100g Calibration Prediction
1. INTRODUCTION 2. OBJECTIVES 3. METHODOLOGY 4. RESULTS 5.CONCLUSIONS Glucose(g glucose/l) 3 PLS components BandRange :1100-1850nm,2094-2238nm Pretreatment: SG 2D 11points 2order Calibration range: 0,64-3,94(g/l) RMSEC=0,13 g/100g Prediction range:1,19-3,55(g/l) RMSEP=0,09 g/100g Calibration Prediction
1. INTRODUCTION 2. OBJECTIVES 3. METHODOLOGY 4. RESULTS 5.CONCLUSIONS Brix (brix degrees) 3 PLS components Band Range :1100-1834nm,2120-2320nm Pretreatment: SG 2D 11 points 2 order Calibration range: 3,6-10,6 (brix degrees) RMSEC=0,31brix degrees Prediction range:4,2-9,8 (brix degrees) RMSEP=0,25 brix degrees Calibration Prediction
1. INTRODUCTION 2. OBJECTIVES 3. METHODOLOGY 4. RESULTS 5.CONCLUSIONS Dry Matter (g dry matter/100g fresh matter) 5 PLS components Band Range : 2200-2340nm Pretreatment: SG 2D 11points 2order Calibration range: 5,16-11,55 (g/100g) RMSEC=0,36 g/100g Prediction range:5,50-11,00(g/100g) RMSEP= 0,26 g/100g Calibration Prediction
1. INTRODUCTION 2. OBJECTIVES 3. METHODOLOGY 4. RESULTS 5.CONCLUSIONS Summary table for models of chemical parameters
1. INTRODUCTION 2. OBJECTIVES 3. METHODOLOGY 4. RESULTS 5.CONCLUSIONS Tomato sensory models
1. INTRODUCTION 2. OBJECTIVES 3. METHODOLOGY 4. RESULTS 5.CONCLUSIONS Sweetness scale 0-10 3 PLS components Band Rang:2120-2320nm Pretreatment: 2D 7point Calibration range: 2,03-10,07 RMSEC=0,95 Prediction range:3,59-9,45 RMSEP=0,83 Calibration Prediction
1. INTRODUCTION 2. OBJECTIVES 3. METHODOLOGY 4. RESULTS 5.CONCLUSIONS Flavourscale 0-10 7 PLS components Band Rang: 2120-2320nm Pretreatment: 2D 7point Calibration range: 2,3-7,7 RMSEC=0,66 Prediction range:3,55-6,68 RMSEP=0,73 Calibration Prediction
1. INTRODUCTION 2. OBJECTIVES 3. METHODOLOGY 4. RESULTS 5.CONCLUSIONS Aroma scale 0-10 3 PLS components Band Rang: 1100-2498nm Pretreatment: none Calibration range: 1,62-7,76 RMSEC=0,95 Prediction range:1,7-6,51 RMSEP=0,77 Calibration Prediction
1. INTRODUCTION 2. OBJECTIVES 3. METHODOLOGY 4. RESULTS 5.CONCLUSIONS Floury scale 0-10 3 PLS components Band Rang: 2120-2320nm Pretreatment: 2D 7point Calibration range: 1,11-5,96 RMSEC=0,66 Prediction range:1,22-4,65 RMSEP=0,62 Calibration Prediction
1. INTRODUCTION 2. OBJECTIVES 3. METHODOLOGY 4. RESULTS 5.CONCLUSIONS Crispiness scale 0-10 5 PLS components Band Rang: 2120-2320nm Pretreatment: 2D 7point Calibration range: 1,65-7,96 RMSEC=0,96 Prediction range:1,89-6,33 RMSEP=0,84 Calibration Prediction
1. INTRODUCTION 2. OBJECTIVES 3. METHODOLOGY 4. RESULTS 5.CONCLUSIONS Skin perception scale 0-10 3 PLS components Band Rang: 1100-2498nm Pretreatment: 2D 11point Calibration range: 4,71-8,89 RMSEC=0,73 Prediction range: 5,69-8,49 RMSEP=0,79 Calibration Prediction
1. INTRODUCTION 2. OBJECTIVES 3. METHODOLOGY 4. RESULTS 5.CONCLUSIONS Acidity scale 0-10 4 PLS components Band Rang: 2120-2320nm Pretreatment: 2D 7point Calibration range: 1,79-8,1 RMSEC=0,96 Prediction range: 2,71-7,68 RMSEP=1,04 Calibration Prediction
1. INTRODUCTION 2. OBJECTIVES 3. METHODOLOGY 4. RESULTS 5.CONCLUSIONS Explosiveness scale 0-10 5 PLS components Band Rang: :2120-2320nm Pretreatment: 2D 7point Calibration range: 1,5-2,56 RMSEC=0,05 Prediction range: 1,75-2,44 RMSEP=0,20 Calibration Prediction
1. INTRODUCTION 2. OBJECTIVES 3. METHODOLOGY 4. RESULTS 5.CONCLUSIONS Summary table for models of sensorial parameters
1. INTRODUCTION 2. OBJECTIVES 3. METHODOLOGY 4. RESULTS 5.CONCLUSIONS • NIRS has shown to be a powerful tool for quality control in tomato manufacturing. • The main goal of this study is the capacity of prediction with PLS models from up to 12 chemical and sensory parameters with an unique spectrum. • The results of validation for chemical and sensorial parameters show us low residual and error values and good predictive performances. • In the models for sensorial parameters, the ability of NIRS & chemometrics to perform the experience of human experts has been demonstrated.
Monitoring chemical and sensory parameters of tomato product with near infrared spectroscopy Dong Sun, Jordi Cruz Sánchez, Joan CasalsMissió, Joan Simó, Josep Sabaté Reboll, ManelAlcalàBernàrdez Thanks!!! Any question??? March 3rd 2016