Download
1 / 59
600 likes | 880 Vues
Fluoride and IQ research in China. Prof. Xiang Quanyong Jiangsu Province CDC,China quanyongxiang@sina.com.cn 2014.09.06. Main content. Endemic fluorosis in China Research of the effect of fluoride on neurotoxicology in China

E N D
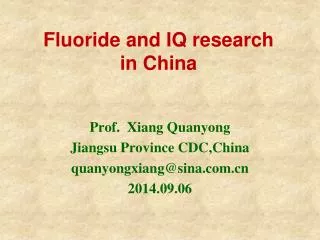
Fluoride and IQ researchin China Prof. Xiang Quanyong Jiangsu Province CDC,China quanyongxiang@sina.com.cn 2014.09.06
Main content • Endemic fluorosis in China • Research of the effect of fluoride on neurotoxicology in China • Endemic fluorosis in Jiangsu Province • Our research results on fluoride and IQ
黑龙江 吉林 辽宁 河北 北京 天津 新疆 内蒙古 山东 山西 宁夏 青海 江苏 甘肃 河南 陕西 安徽 上海 西藏 湖北 浙江 四川 江西 湖南 福建 贵州 广东 云南 广西 台湾 海南 Endemic fluorosis in China Caused by drinking water Severe endemic fluorosis areas Midrange endemic fluorosis areas Light endemic fluorosis areas Non endemic fluorosis areas Sun DJ. The progress on the state and prevention of endemic disease in China. Chin J Dis Control Pre. 2002
Endemic fluorosis in China • The highest concentration of fluoride in drinking water was over 30 mg/L in China. • There were 1306 counties with endemic fluorosis areas caused by drinking water. • There were 150445 villages with endemic fluorosis areas. • Total number of dental fluorosis patients were 40.66 millions. • Total number of skeletal fluorosis parients were 2.60 millions. Sun DJ. The progress on the state and prevention of endemic disease in China. Chin J Dis Control Pre. 2002
Endemic Fluorosis Geographic distribution of skeletal fluorosis in China caused by higher drinking water (in 1980’s)
黑龙江 吉林 辽宁 河北 北京 天津 新疆 内蒙古 山东 山西 宁夏 青海 江苏 甘肃 河南 陕西 安徽 上海 西藏 湖北 浙江 四川 江西 福建 贵州 湖南 广东 云南 广西 台湾 海南 Endemic fluorosis in China Caused by burning coal Severe fluorosis areas caused by burning coal Sun DJ. The progress on the state and prevention of endemic disease in China. Chin J Dis Control Pre. 2002
Endemic Fluorosis Skeletal fluorosis
Endemic fluorosis in China • The prevalence of fluorosis in burning coal areas was very severe. • Only five provinces, but the total skeletal fluorosis patients were 1.335 millions. • The prevalence of endemic fluorosis was much higher than that in drinking water areas. Sun DJ. The progress on the state and prevention of endemic disease in China. Chin J Dis Control Pre. 2002
黑龙江 吉林 辽宁 河北 北京 天津 Inner Mongolia Xinjiang 山东 山西 宁夏 Qinghai 江苏 Gansu 河南 陕西 安徽 上海 Tibet 湖北 浙江 四川 江西 湖南 福建 贵州 广东 云南 广西 台湾 海南 Endemic fluorosis in China Caused by brick tea Severe fluorosis areas caused by brick tea in West China Zhao XH, et al.. China Public Health. 2000
Endemic fluorosis in China • The highest level of fluoride in brick tea was over 1000 mg/kg. • The endemic fluorosis caused by brick tea were mainly in the areas of ethnic minorities in China. They have the traditional customs of using (or drinking) brick tea. • The prevalence of endemic fluorosis in these areas was not very clearly.
Endemic Fluorosis Investigations of fluorosis in some endemic fluorosis areas caused by drinking brick tea
Endemic Fluorosis • The distribution of the areas and the prevalence • of fluorosis caused by drinking brick tea are • now being investigated in China • The current results indicate that in these areas • the dental fluorosis in children were mild, but • the skeletal fluorosis were comparative severe
Endemic fluorosis in China • In China, endemic fluorosis was described about 1570 years ago (265-420 in Jing Dynasty). • The nationwide investigation of endemic fluorosis caused by drinking water and burning coal was carried out from 1980’s in China. The distribution and the prevalence of endemic fluorosis has become increasingly clear.
Endemic fluorosis in China • The investigation of endemic fluorosis caused by Brick tea was carried out in 1990’s. • But the prevalence and distribution of that in China have not been defined clearly because there were 56 nationalities impacted, and the areas with brick tea fluorosis were very large.
Endemic fluorosis in China • Now about 90% endemic fluorosis villages have had their tap water sources (shallow to deep wells) changed to levels of fluoride <1.0 mg/L. • Over 80% villages with high level of fluoride caused by burning coal were used safety stove
Main content • Endemic fluorosis in China • Research of the effect of fluoride on neurotoxicology in China • Endemic fluorosis in Jiangsu Province • Our research results on fluoride and IQ
Published papers in Chinese • Fluoride and neurotoxicity 63 Dai, et.al (1983) • Fluoride and brain injured 20 Dai, et al (1989) • Fluoride and IQ 10 1991 • Fluoride and IQ 40 (in English)
Main content • Endemic fluorosis in China • Research of the effect of fluoride on neurotoxicology in China • Endemic fluorosis in Jiangsu Province • Our research results on fluoride and IQ
黑龙江 吉林 辽宁 河北 北京 天津 新疆 内蒙古 山东 山西 宁夏 青海 江苏 甘肃 河南 陕西 安徽 上海 西藏 湖北 浙江 四川 江西 湖南 福建 贵州 广东 云南 广西 台湾 海南 1% areas of China 5% population of China 10% financial revenue of China The location of Jiangsu province in China
Endemic Fluorosis Jiangsu Province: In Jiangsu Province there is only one type of endemic fluorosis and that is caused by high level fluoride in drinking water
Endemic Fluorosis The distribution of the fluoride level (mg/L) in Jiangsu Province (the map of Moran’s LISA)
Endemic Fluorosis The distribution of the prevalence of dental fluorosis in Jiangsu Province (the map of Moran’s LISA)
Endemic Fluorosis There are 2026 villageswith endemic fluorosis (236 severe, 298 moderate, 992 mild), the population in the endemic fluorosis were 3.66 million. The average prevalence of dental fluorosis in these areas was 66.76%, estimated cases of skeletal fluorosis were about 0.2 million.
Endemic Fluorosis Since 1996, about 95% endemic fluorosis villages have had defluoridationprojects which provide (use deep underground water or surface water) tap water with low fluoride level (<1.0mg/L) for the residents.
Endemic Fluorosis Hydria PVC Pipe water tap
Main content • Endemic fluorosis in China • Research of the effect of fluoride on neurotoxicology in China • Endemic fluorosis in Jiangsu Province • Our research results on fluoride and IQ
Research work in Jiangsu CDC Risk assessment of the fluoride in environment on resident’s health Assessment of the effect of defluoridation projects Study on the damage mechanism of fluoride on nervous system (with Zhejiang Normal University) Technology of the defluoridation and others
The distribution of endemic fluorosis areas in Sihong County Wamiao Xinhuai Severe areas Middle areas Mild areas
Material and Methods In Wamiao 93% of children (222 out of 238) were included for the study, while in Xinhuai, 95% were included (290 out of 305). Children who had been absent from either village for two years or longer, or who had a history of brain disease or head injury, were excluded.
Material and Methods The children in Wamiaowere divided into five subgroups according to the level of fluoride in their drinking water: <1.0 mg/L (group A), 1.0–1.9 (B), 2.0– 2.9 (C), 3.0–3.9 (D), >3.9(E), while those in Xinhuai were considered as a single group (F).
Material and Methods The Combined Raven’s Test for Rural China (CRT-RC) was used to measure the children’s IQ, published by Huadong Normal University
Material and Methods The scores for IQ in the CRT-RC were ranked as: mental retardation (IQ <70), borderline (IQ 70–79), dull normal (IQ 80–89), normal (IQ 90– 109), bright normal (IQ 110–119), superior (IQ120–129), and very superior (IQ >129).
Table 1 Level of fluoride in drinking water in Wamiao and Xinhuai —————————————————————————————————————— Village No. samples Fluoride in drinking water(mg/L) t p ——————————————— Mean S.D Range —————————————————————————————————————— Wamiao 222 2.470.79 0.57 — 4.50 44.97<0.001 Xinhuai 290 0.360.15 0.18 — 0.76 —————————————————————————————————————— Table 2 Level of fluoride in urine, in mg F/L, in Wamiao and Xinhuai —————————————————————————————————————— Village No.samples Urinary fluoride (mg/L) t p ———————————————— MeanS.D. Range —————————————————————————————————————— Wamiao 155 3.471.95 0.90 — 12.50 13.82<0.001 Xinhuai 135 1.110.39 0.37 — 2.50 —————————————————————————————————————— Results and Discussion
Results and Discussion Table 3. Ratio of urinary fluoride to creatinine in children in Wamiao and Xinhuai ——————————————————————————————————— Village No.samples Urinary fluoride/Cre (mg F/mmol Cre) t p ———————————————— MeanSD Range ——————————————————————————————————— Wamiao 155 0.82±0.75 0.13 — 4.69 8.96 <0.001 Xinhuai 135 0.240.10 0.09 — 0.71 ———————————————————————————————————
Results and Discussion Table 4. Children’s IQ in Wamiao and Xinhuai ———————————————————————————————————— Village male female total ————————————————————————————— N MeanSD N MeanSD N MeanSD Range ———————————————————————————————————— Wamiao 122 94.7313.09 100 88.7212.16* 222 92.0213.00 54-126 Xinhuai 159 100.6913.52# 131 100.0812.87# 290 100.4113.21# 60-128 ———————————————————————————————————— *P <0.01 compared with male data of Wamiao village. #P< 0.01 compared with Wamiao village.
Results and Discussion Table 5. IQ distribution of children in Wamiao and Xinhuai ———————————————————————————————————— Wamiao Xinhuai IQ ——————————————————————————— Male Female Total (%) Male Female Total (%) ———————————————————————————————————— 130 or higher 0 0 0 (0) 0 0 0 (0) 120-129 5 0 5 (2.25) 11 3 14 (4.83) 110-119 9 4 13 (5.86) 38 28 66 (22.76) 90-109 62 43 105 (47.30) 75 75 150 (51.72) 80-89 31 34 65 (29.28) 25 17 42 (14.48) 70-79 12 14 26 (11.71) 9 4 13 (4.48) 69 or lower 3 5 8 (3.60) 1 4 5 (1.72) ———————————————————————————————————— Total 122 100 222 (100) 159 131 290 (100) ————————————————————————————————————
Results and Discussion Table 6. Level of fluoride in drinking water and children’s IQs ———————————————————————————————————— Fluoride in drinking water(mg/L)IQ and the rate of retardation Village & —————————————————————————————— Group No. samples Water fluoride level No. children IQ Rate of IQ<80 (MeanSD) (MeanSD) (%) ———————————————————————————————————— Xinhuai F 290 0.360.15 290 100.4113.21 6.55 Wamiao A 9 0.750.14 9 99.5614.13 0.00 B 42 1.530.27 42 95.2112.22* 9.52 C 111 2.460.30 111 92.1912.98**14.41* D 52 3.280.25 52 89.8811.98** 21.15** E 8 4.160.22 8 78.3812.68** 37.50** ———————————————————————————————————— * P<0.05, ** P<0.01 compared with the group F.
Results and Discussion Figure 1 Concentration-response relationship between an IQ<80 score and the level of fluoride in drinking water.
Results and Discussion Figure 2.Correlation between urinary fluorideFigure 3.Correlation between urinary fluoride (directly measured) and IQ (creatinine-adjusted) and IQ
Table 7. Fluoride in drinking water and in urine (MeanSD) ———————————————————————————————— No. Samples Fluoride in drinking Urinary fluoride ————————————— water (mg/L) mg/L mg/mmolCre ———————————————————————————————— 142 0.390.15 1.140.49 0.250.22 32 1.150.29 2.591.70 0.610.47 80 2.440.30 3.671.97 0.850.67 32 3.220.18 3.771.86 0.860.81 4 4.050.01 4.652.39 2.171.73 ———————————————————————————————— Results and Discussion Pearson correlation coefficients were 0.653 and 0.503 respectively, p<0.001)
Table 8. Mean IQ of children and family income in Wamiao and Xinhuai ——————————————————————————————————— Family income Wamiao Xinhuai (yuan/yr) ————————————————————————— No. children IQ(MeanSD) No. children IQ(MeanSD) ——————————————————————————————————— 1000 or below 42 93.8812.04 40 99.4511.82 1001-2000 128 91.7312.41 173 100.5413.23 2001-3000 39 93.3615.24 59 100.3414.39 over 3000 13 84.8513.37 18 101.6112.88 ——————————————————————————————————— Total 222 92.0213.00 290 100.4113.21 ——————————————————————————————————— Results and Discussion There were no significant relationships in both Wamiao and Xinhuai village (Pearson correlation coefficients: –0.096 and 0.027, respectively, p>0.05).
Table 9. Mean IQ and education level of parents in Wamiao and Xinhuai ———————————————————————————————————— Parents education level Wamiao Xinhuai ———————————————————————— No. children IQ (MeanSD) No. children IQ (MeanSD) ———————————————————————————————————— Primary school and below 74 93.2612.69 38 103.5011.72 Junior high school 118 92.1612.59 131 100.0913.19 Senior high school and above 30 88.4315.05 121 99.7913.64 ———————————————————————————————————— Results and Discussion No significant relationships were present between the children’s IQ and education level of parents, in both Wamiao and Xinhuai village (Pearson correlation coefficient: –0.119 and 0.113, respectively, p>0.05)
Table 10. Urinary iodine in children in Wamiao and Xinhuai ——————————————————————————————————— Village No. samples Urinary iodine (g/L) t p —————————————— MeanSD Range ——————————————————————————————————— Wamiao 46 280.7087.16 131.31 – 497.05 1.04 >0.3 Xinhuai 40 300.9692.88 148.46 – 460.89 ——————————————————————————————————— Results and Discussion Table 11. Ratio of urinary iodine to creatinine in children in Wamiao and Xinhuai —————————————————————————————————— Village No. samples Urinary iodine/Cre (g I/mmol Cre) t p ——————————————— MeanSD Range —————————————————————————————————— Wamiao 46 93.2446.86 36.86 – 251.03 1.07 >0.28 Xinhuai 40 81.2755.91 22.76 – 298.74 ——————————————————————————————————