
Evaluating Climate Predictability from Volcanic Forcing: Insights from Mount Pinatubo's Eruption
This study analyzes the climate response to the 1991 eruption of Mount Pinatubo using the Community Earth System Model (CESM1.0). It evaluates predictability signals in climate models under volcanic forcing, focusing on atmospheric variables such as stratospheric humidity, zonal winds, and temperature profiles. The research quantifies climate model responses using signal-to-noise ratios and compares model outputs with observational data to assess predictive capabilities. This work contributes to understanding how large-scale volcanic events impact climate variance and predictability.

Evaluating Climate Predictability from Volcanic Forcing: Insights from Mount Pinatubo's Eruption
E N D
Presentation Transcript
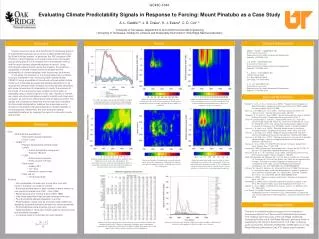
GC43C-1044 Evaluating Climate Predictability Signals in Response to Forcing: Mount Pinatubo as a Case Study A. L. Gaddis1,2, J. B. Drake1, K. J. Evans3, C. D. Cox1,2 1 University of Tennessee, Department of Civil and Environmental Engineering; 2 University of Tennessee, Institute for a Secure and Sustainable Environment; 3Oak Ridge National Laboratory Results Summary Contact Information • Abigail L. Gaddis – agaddis@utk.edu • University of Tennessee • Department of Civil and Environmental Engineering • Knoxville, TN 37996-4134 • J. B. Drake – jdrake4@utk.edu • University of Tennessee • Department of Civil and Environmental Engineering • Knoxville, TN 37996-4134 • K. J. Evans – evanskj@ornl.gov • 1 Bethel Valley Road • P.O. Box 2008, MS 6016 • Oak Ridge, TN 37831-6015 • C. D. Cox– ccox9@utk.edu • University of Tennessee • Department of Civil and Environmental Engineering • Knoxville, TN 37996-4134 Volcanic eruptions serve as a benchmark for assessing aspects of predictability because they provide a sudden global impulse to the Earth’s climate system. In particular, the 1991 eruption of Mt. Pinatubo in the Philippines is of interest since it was the largest aerosol perturbation to the stratosphere in the twentieth century and the most intensely observed eruption on record. Using instrumental measurements during the eruption, the predictive capabilities of climate models may be evaluated and the predictability of climate variables under forcing may be inferred. In this study, the evolution of the climate response to volcanic forcing is simulated in the Community Earth System Model, CESM1.0, using ensembles of forced and unforced global climate model runs. Ensemble averages and standard deviations for all atmospheric climate model variables are systematically calculated, with some comparisons to observations to verify the accuracy of the model. The response for each variable to the eruption is evaluated using a unitless signal to noise ratio. Signals of interest are noted, including stratospheric specific humidity and zonal wind increases, as well as the temperature vertical response profile. The signals are compared to determine the most sensitive variables. For this model configuration, radiative flux responses are the strongest, followed by heat and temperature-related variables in the stratosphere. Additionally, this work examines spatial predictability patterns by mapping the signal to noise ratio zonally and globally. Selected References Global average temperature anomaly signal to noise ratio by pressure level in the atmosphere. Stratospheric temperature shows a strong response to the eruption, as expected. Global average geopotential height anomaly signal to noise ratio by pressure level in the atmosphere. The positive temperature anomalies cause pressure anomalies in the stratosphere. Ensemble averages and standard deviations (shaded) of decadal anomalies with reanalysis data decadal anomalies for global average temperature at 70mb. • Bender, F. A. M., A. M. L. Ekman, et al. (2010). "Response to the eruption of Mount Pinatubo in relation to climate sensitivity in the CMIP3 models." Climate Dynamics 35(5): 875-886. • Boer, G. J., M. Stowasser, et al. (2007). "Inferring climate sensitivity from volcanic events." Climate Dynamics 28(5): 481-502. • Douglass, D. H. and R. S. Knox (2005). "Climate forcing by the volcanic eruption of Mount Pinatubo." Geophysical Research Letters 32(5): 5. • Gent PR, Danabasoglu G, Donner LJ, Holland MM, Hunke EC, Jayne SR, Lawrence DM, Neale RB, Rasch PJ, Vertenstein M, Worley PH, Yang ZL, Zhang MH (2011) The Community Climate System Model Version 4. Journal of Climate 24 (19):4973-4991. doi:10.1175/2011jcli4083.1 • Hansen, J., A. Lacis, et al. (1992). “Potential climate impact of the Mount-Pinatubo eruption." Geophysical Research Letters 19(2): 215-218. • Hansen, J., M. Sato, et al. (1997). "Radiative forcing and climate response." Journal of Geophysical Research-Atmospheres 102(D6): 6831-6864. • Hansen, J., M. Sato, et al. (1997). "Forcings and chaos in interannual to decadal climate change." Journal of Geophysical Research-Atmospheres 102(D22): 25679-25720. • Kalnay, E., et al. (1996). The NCEP/NCAR 40-year reanalysis project. Bull. Amer. Meteor. Soc. 77: 437-470. • Lorenz EN (1963) Deterministic Nonperiodic Flow. J AtmosSci 20 (2):130-141. doi:10.1175/1520-0469(1963)020<0130:dnf>2.0.co;2 • McCormick, M. P., L. W. Thomason, et al. (1995). “Atmospheric effects of the Mt-Pinatubo eruption." Nature 373(6513): 399-404. • Mote PW, Rosenlof KH, McIntyre ME, Carr ES, Gille JC, Holton JR, Kinnersley JS, Pumphrey HC, Russell JM, Waters JW (1996) An atmospheric tape recorder: The imprint of tropical tropopause temperatures on stratospheric water vapor. Journal of Geophysical Research-Atmospheres 101 (D2):3989-4006. doi:10.1029/95jd03422 • Oltmans SJ, Vomel H, Hofmann DJ, Rosenlof KH, Kley D (2000) The increase in stratospheric water vapor from balloonborne, frostpoint hygrometer measurements at Washington, DC, and Boulder, Colorado. Geophys Res Lett 27 (21):3453-3456. doi:10.1029/2000gl012133 • Robock, A. (2000). "Volcanic eruptions and climate." Reviews of Geophysics 38(2): 191-219. • Stenchikov G (2006) Arctic Oscillation response to volcanic eruptions in the IPCC AR4 climate models. Journal of Geophysical Research 111 • Uppala, S., et al. (2005). The ERA-40 re-analysis. Quart. J. R. Meteorol. Soc. 131: 2961-3012. • Von Storch J-S (2008) Toward Climate Prediction: Interannual Potential Predictability due to an Increase in CO2 Concentration as Diagnosed from an Ensemble of AO GCM Integrations. Journal of Climate 21:4607-4628 Methods • Data • NCEP/NCAR and ERA-40 • Observation-based reanalysis • 2.5x2.5o grid • CESM 1.0 • Physics-based global climate model • CAM4 • Active atmosphere component • Eulerian T85 grid • CLM4 • Active land component • Finite volume 0.9o grid • Data ocean • Hadley SST • 1x1ogrid • Next work: active ocean • Data sea ice • CICE prescribed • Analysis • Two ensembles of model runs: 6 long term runs with volcano, 6 branch runs without volcano • Extracted gridded data for each variable in every model run over period of interest (Jan 1991 – Dec 1994) • Removed long term monthly means (1981-1990) • Calculated ensemble mean decadal anomaly over time • Found ensemble standard deviation over time • Plotted signal to noise ratio as ensemble mean difference divided by ensemble standard deviation for control ensemble • Plotted weighted global average signal to noise ratio • Graphed signal to noise ratio at each grid point and as zonal and meridional averages. • Compared signal to noise ratio for each variable Global average specific humidity anomaly signal to noise ratio by pressure level in the atmosphere. The stratosphere is more arid than the troposphere due to a “freeze dry” mechanism at the cold tropical tropopause, where most air enters the stratosphere. Spatial distribution of temperature anomaly signal to noise ratio at the tropopause. Following the eruption, the tropical tropopause warms, allowing moisture into the stratosphere. Global average zonal wind anomaly signal to noise ratio by pressure level in the atmosphere. Pressure and temperature gradient changes in the stratosphere lead to increased zonal winds; spatial analysis further specifies an increase in stratospheric polar night jets. Acknowledgements This work is funded through the support of theUniversity of Tennessee Institute for a Secure and Sustainable Environment. This research used resources of the Oak Ridge Leadership Computing Facility at the Oak Ridge National Laboratory, which is supported by the Office of Science of the U.S. Dept. of Energy under Contract No. DEAC05-00OR22725.CESM data run on Oak Ridge National Laboratory’s Cray XT5 Jaguar supercomputer. Signal to noise ratio over time for single level model variables. Radiation flux variables and tropopause-related variables are strongest. Table of maximum signal to noise ratio values by level for model variables with multiple vertical levels. Signals are generally strongest in the stratosphere, especially for temperature and heat-flux related variables. Strong but short-lived signals were noted in cloud variables near the tropopause.