
Introduction
Methodology for 3D Wind Retrieval from HIWRAP Conical Scan Data: Preliminary Results from Hurricane Matthew. Ka, inner beam (30 deg). 1. 9. A. X = -5 km. 5 km. B. 3. 5. D. 8. 2. Lihua Li NASA/GSFC. Ramesh Srivastave Univ. of Chicago. Gerry Heymsfield GSFC/NASA. Lin Tian

Introduction
E N D
Presentation Transcript
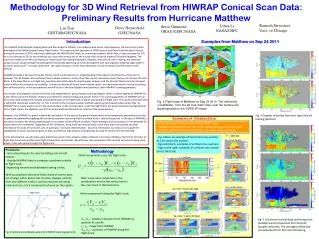
Methodology for 3D Wind Retrieval from HIWRAP Conical Scan Data: Preliminary Results from Hurricane Matthew Ka, inner beam (30 deg) 1 9 A X = -5 km 5 km B 3 5 D 8 2 Lihua Li NASA/GSFC Ramesh Srivastave Univ. of Chicago Gerry Heymsfield GSFC/NASA Lin Tian GESTAR/GSFC/NASA Steve Guimond ORAU/GSFC/NASA C 7 4 Ka, outer beam (40 deg) 6 10 km X = -10 km Introduction Examples from Matthew on Sep 24 2011 The HIWRAP (High-Altitude Imaging Wind and Rain Airborne Profiler) is an airborne dual-beam, dual-frequency (14 and 35 GHz) radar developed at the NASA Goddard Space Flight Center. The radar was first deployed in GRIP (Genesis and Rapid Intensification Process) during the summer of 2010, mounted underneath the NASA Global Hawk, an unmanned airplane, which flew at a ground speed of 176 m/s at an altitude of 20. Its two antennas spin about the vertical axis of the aircraft with incidence angles of 30 and 40 degrees. The scans are similar to the PPI scan of ground- based radar but looking downward. However, since the aircraft is moving, the antennas sweep out two spirals through the atmosphere, essentially observing all of the atmosphere with two separate incidence angle within +- 12 (inner beam) and +- 17 (outer beam) km. The radar resolution is finer than 650 meters in the horizontal and 150 meters in the vertical. HIWRAP provides a 3D view of tropical storms, which could advance our understanding of the physics and dynamics of the storms. However, the 3D Doppler data obtained from multiple locations, as the plane flies, do not necessarily mean that we can retrieve 3D wind fields. If the plane flies in a straight line, we obtain essentially data for dual-Doppler analyses and the 3D wind field cannot be retrieved unless additional constraints are available. In order to retrieve 3D winds from multiple radars, we need observations from at least three non-collinear points. In this presentation, we will focus on the dual-Doppler wind synthesis under HIWRAP scanning geometry. In principle, dual-Doppler synthesis that was well-established for ground-based scanning Doppler radars could be applied to HIWRAP for wind retrieval once the Doppler velocity is corrected for velocity folding and aircraft motion. For scanning geometry of HIWRAP, we can derive the wind components parallel and perpendicular to the flight track in planes containing the flight track. This can be illustrated with a cylindrical coordinate system (Fig. 1). This is similar to the co-plane analysis method used by ground-based radars except that for HIWRAP the co-plane angle is zero in the vertical plane. In the vertical plane, under the flight track, the wind components perpendicular to the flight track is the algebraic sum of the vertical wind and the terminal velocity of the hydrometeors. However, this HIWRAP ‘co-plane’ method has limitations. In the case of the ground-based radar, wind components perpendicular to the co-plane are obtained by applying the continuity equation assuming that the vertical wind is zero at the ground. In the case of HIWRAP, a boundary condition for winds perpendicular to a co-plane will be difficult to obtain. Other strategies and constraints for retrieving the 3D winds need to be considered. Regardless of this limitation, along track and vertical winds in the nadir plane still provide valuable information for study of hurricanes and, in particular, hurricane intensification. Also, this information can help us to evaluate the applicability of linear wind assumption so that conventional VAD analysis could perhaps be used to retrieve the 3D wind field. In this presentation, we will show some preliminary results from analysis of data collected in hurricane Matthew. More than 10 hours of flight data have been gridded onto flight relative track coordinates. We will show some examples of the derived vertical and along track winds in the nadir plane through the flight track.. Fig. 2 Flight track of Matthew on Sep 24 2010. The reflectivity (uncalibrate) from the aft look (half circle) near the surface are superimposed on the GOES IR image. Fig. 4 Doppler velocities from fore (top) and aft looking (bottom). Examples of Gridded Data • 1x1x0.25 km grid interval with Yt along flight track; • Weighted (by distance from the center point) average or nearest point; • Gridded with forward/backward half circle of the scan separately; Y = 100 km - Fig. below: an example of horizontal cross-section at 2 km above the surface; - Figs at bottom: examples of vertical cross-sections; - Figs on the right: examples of vertical cross-section across the track; Ku, inner beam • Procedures: • - Correcting Doppler for velocity folding and aircraft motion; • - Gridded HIWRAP data in cartesian coordinate relative to flight track; • Separating forward and backward looking circles; • With assumptions that wind fields inside of storms does not change within about two minutes, Doppler velocity from two different looks is used to calculate the along track and cross track components of wind on the coplan. Methodology Wind components cross the flight track: Y = 100 km X= 5km Ka, inner beam Y X= -5km Note: cross track component is the combination wind in the vertical and in the cross track in the horizontal. X Ku, outer beam 0 km Wind components along the flight track: Ka, outer beam Vr1, Vr2 – Doppler velocities from HIWRAP at position #1 and #2. r1, r2 – range from HIWRAP. Y01, Y02 – positions of HIWRAP along the flight track 0 km Fig. 5 Calculated vertical (top) and along track (middle) wind components from fore/aft Doppler velocities; The averaged reflectivity (uncalibrated) from fore and aft looking. Fig. 1 Cylindrical coordinate system for HIWRAP scanning geometry.


