Characterization of Graphene and Metal Ion Response Using Advanced Spectroscopy Techniques
This study presents a comprehensive characterization of graphene employing various spectroscopic methods, including Transmission Electron Microscopy (TEM), UV-Vis, FTIR, and Raman spectroscopy. Additionally, the isotopic patterns of detected peaks at m/z 472 and 488 are illustrated, along with a graphical simulation of these patterns. The response of Graphene-Au-Layered Double Hydroxide (GALDI) to various metal ions, particularly in the presence of Hg²⁺, is also detailed. Key data includes peak assignments from GALDI-MS analysis, providing insight into interactions with metal ions.

Characterization of Graphene and Metal Ion Response Using Advanced Spectroscopy Techniques
E N D
Presentation Transcript
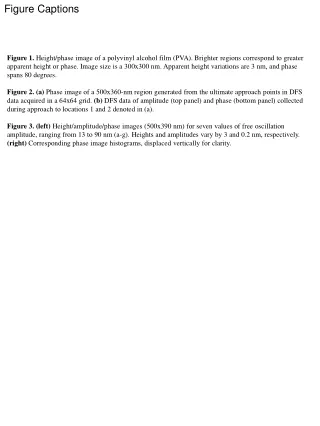
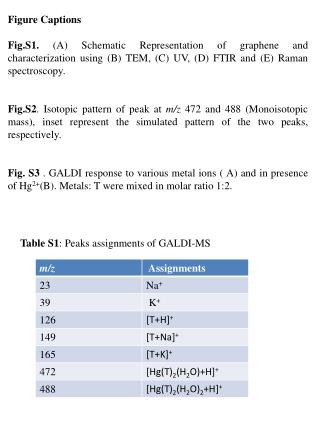
Figure Captions Fig.S1. (A)Schematic Representation of graphene and characterization using (B) TEM, (C) UV, (D) FTIR and (E) Raman spectroscopy. Fig.S2. Isotopic pattern of peak at m/z 472 and 488 (Monoisotopic mass), inset represent the simulated pattern of the two peaks, respectively. Fig. S3 . GALDI response to various metal ions ( A) and in presence of Hg2+(B). Metals: T were mixed in molar ratio 1:2. Table S1: Peaks assignments of GALDI-MS
Fig.S1 A 1.Oxidation (H2SO4, KMnO4, H2O2) 2.Reduction (NH2NH2) B C E D
Fig.S2 1 2 1 2
Fig.S4 A B