Download
1 / 10
100 likes | 189 Vues
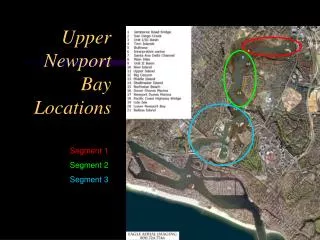
30-Day Running Geometric Means for the Upper Newport Bay Stations for 2000 - 2002

E N D
30-Day Running Geometric Means for the Upper Newport Bay Stations for 2000 - 2002 The following graphs provide the 30-day running geometric means for the Upper Newport Bay stations for total coliforms, fecal coliforms and enterococci between April 1 and October 31 during 2000 - 2002. Data representing rain advisory periods are omitted from this analysis. Running geometric means (which include at least 5 samples within the preceding 30 days) are used in addition to single sample results to detect exceedences under AB 411 Ocean Water-Contact Sports Standards. Running geometric means are useful in providing water quality data indicative of the trend at a given monitoring site without the influence of occasional, temporary single sample spikes in indicator levels. Each station is represented by a single graph depicting the relative levels of total coliforms, fecal coliforms and enterococci, together with the standard for each indicator. The lower limit for each indicator is determined by the limit of detection for the analytical laboratory, and is less than 10 CFU/100 ml for some stations. Vertical lines on the graphs separate annual AB 411 periods by year. Each running mean is represented by a continuous line and is not carried forward to subsequent years.
Newport Bay, Newport Dunes – West Running Geometric Means for Total Coliform, Fecal Coliform and EnterococcusAB 411 Periods (4/1 through 10/31), 2000-2002 2000 2001 2002 Dry Weather Data
Newport Bay, Newport Dunes – Middle Running Geometric Means for Total Coliform, Fecal Coliform and EnterococcusAB 411 Periods (4/1 through 10/31), 2000-2002 2000 2001 2002 Dry Weather Data
Newport Bay, Newport Dunes – EastRunning Geometric Means for Total Coliform, Fecal Coliform and EnterococcusAB 411 Periods (4/1 through 10/31), 2000-2002 2000 2001 2002 Dry Weather Data
Newport Bay, Newport Dunes – North Running Geometric Means for Total Coliform, Fecal Coliform and EnterococcusAB 411 Periods (4/1 through 10/31), 2000-2002 2000 2001 2002 Dry Weather Data
Newport Bay, North Star Beach Running Geometric Means for Total Coliform, Fecal Coliform and EnterococcusAB 411 Periods (4/1 through 10/31), 2000-2002 2000 2001 2002 Dry Weather Data
Newport Bay, De AnzaRunning Geometric Means for Total Coliform, Fecal Coliform and EnterococcusAB 411 Periods (4/1 through 10/31), 2000-2002 2000 2001 2002 Dry Weather Data
Newport Bay, Bayshore BeachRunning Geometric Means for Total Coliform, Fecal Coliform and EnterococcusAB 411 Periods (4/1 through 10/31), 2000-2002 2000 2001 2002 Dry Weather Data
Newport Bay, Vaughn’s LaunchRunning Geometric Means for Total Coliform, Fecal Coliform and EnterococcusAB 411 Period (4/1 through 10/31), 2000* 2000 *Sufficient data to calculate geometric means not available for years 2001 and 2002. Dry Weather Data
Newport Bay, Ski ZoneRunning Geometric Means for Total Coliform, Fecal Coliform and EnterococcusAB 411 Period (4/1 through 10/31), 2000* *Sufficient data to calculate geometric means not available for years 2001 and 2002. 2000 Dry Weather Data