Download
1 / 26
260 likes | 489 Vues
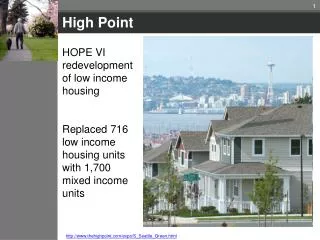
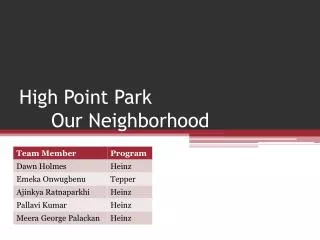
High Point Park Our Neighborhood. Imagine!. Product Concept The Neighborhood Market & Competitor Analysis Triple Bottom Line Approach Financial Social Green Roadmap to Success. Agenda . Our Neighborhood 840 feet in the Air. Welcome to the Neighborhood .

E N D
Product Concept • The Neighborhood • Market & Competitor Analysis • Triple Bottom Line Approach • Financial • Social • Green • Roadmap to Success Agenda
Welcome to the Neighborhood Functions in winter and summer
Unique Product in an Untapped Market Total Market Area Ticket
Relatively Low Implementation Cost Key Assumptions: Soft Cost is 7% 20% Contingency Cost Maintenance Cost is 30% of Gross Revenue 20% of NOI saved as cash reserve 30% tax rate
Multiple Revenue Streams Key Assumptions: $10 Ticket Price 70% Utilization of Conference $857 / Sq-ft for restaurant revenue 10% profit sharing 7% of Pittsburgh population 20% of Tourist population
The economic cost structure is not significantly increased by ‘going green’ Reinvest Savings in Green Energy andSocial Projects
Buying local: $24M construction $1M every year local food Employing Welfare-to-work: 90-100restaurant 30-40conference 4.5% job market tourism In-kind donations Free tickets to schools Free exhibition space for children for green industry Quantifiable Social Benefits
Owners: • US Steel Tower • Restaurant owner • Vendors • Regulations: State and Federal • City ordinances • Workforce: • Welfare to work agencies • Raw Material: • local providers • Funding Engaged and DedicatedStakeholders • Resource • Regulate • Public Interest • Knowledge • Community • Environmental groups • Hospitality Industry • Green Industry • Project Managers: • Construction • Architects • Expert/consultant: • Green Building Alliance • City engineers • Dicks Construction • Marketing consult
Roadmap To Success 2010 2011 2013 2014
Q&A Session Team Members Dawn Holmes – Heinz Emeka Onwugbenu – Tepper AjinkyaRatnaparkhi – Heinz Pallavi Kumar – Heinz Meera George Palackan – Heinz
A business model to measure the triple bottom line Social Entrepreneurship Customer relations Partner network Good or service Key activities Customer or market Distribution channels Key resources Economic Cost structure Economic Revenue streams Environmental Cost structure Environmental Revenue streams Social Cost structure Social Revenue • Self sufficient from mostly un-related income • Success measured for each bottom line