Download
1 / 47
580 likes | 1.23k Vues
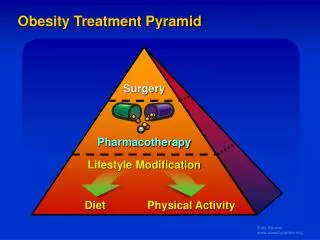
Surgery. Pharmacotherapy. Lifestyle Modification. Diet. Physical Activity. Obesity Treatment Pyramid. Guide for Selecting Obesity Treatment. BMI Category (kg/m 2 ).

E N D
Surgery Pharmacotherapy Lifestyle Modification Diet Physical Activity Obesity Treatment Pyramid
Guide for Selecting Obesity Treatment BMI Category (kg/m2) The Practical Guide: Identification, Evaluation, and Treatment of Overweight and Obesity in Adults. October 2000, NIH Pub. No.00-4084
Short-term Obesity Therapy Does Not Result in Long-term Weight Loss Diet alone Behavior therapy Combined therapy Change in Weight (kg) Baseline End ofTreatment 1-yearFollow-up 5-yearFollow-up Wadden et al. Int J Obes 1989;13 (Suppl 2):39.
Sustained Weight Loss Can Be Achieved with Behavior Modification Therapy Active Treatment No Active Treatment Women Weight Loss (kg) Men 0 2 4 6 8 10-12 Years Björvell and Rössner. Int J Obes Relat Metab Disord 1992;16:623.
Cardinal Behaviors of Successful Long-term Weight ManagementNational Weight Control Registry Data • Self-monitoring: • Diet: record food intake daily, limit certain foods or food quantity • Weight: check body weight >1 x/wk • Low-calorie, low-fat diet: • Total energy intake: 1300-1400 kcal/d • Energy intake from fat: 20%-25% • Eat breakfast daily • Regular physical activity: 2500-3000 kcal/wk (eg, walk 4 miles/d) Klem et al. Am J Clin Nutr 1997;66:239. McGuire et al.Int J Obes Relat Metab Disord 1998;22:572.
External factors Emotions, Drugs Food characteristics Lifestyle behaviors Environmental cues + + Regulation of Food Intake Brain Central Signals Stimulate Inibit NPY AGRP galanin Orexin-A Dynorphin ECS/CB1 α-MSH CRH/UCN GLP-I CART NE 5-HT Peripheral signals Peripheral organs Glucose CCK, GLP-1,Apo-A-IVVagal afferents Insulin GhrelinLeptinCortisol Gastrointestinaltract FoodIntake Adiposetissue Adrenal glands
Meta-analysis of RCTs Evaluating Effect of Orlistat Therapy on Weight Loss at 1-Year *All subjects had type 2 diabetes WMD=weighted mean difference -10 -5 0 5 10 FavoursTreatment FavoursControl Padwal et al. Int J Obes 2003;27:1437
Effect of Long-term Orlistat Therapy on Body Weight -4.1 kg Placebo Change in Weight (kg) -6.9 kg Orlistat P<0.001 vs placebo 0 52 104 156 208 Weeks Torgenson et al. Diabetes Care 2004;27:155
Gastrointestinal Side Effects of Orlistat Therapy Values are percentage of subjects. Sjostrom et al. Lancet 1998;352:167.
-10 -5 0 5 10 FavoursTreatment FavoursControl Meta-analysis of RCTs Evaluating Effect of Sibutramine Therapy on Weight Loss at 1-Year • All subjects had hypertension • WMD=weighted mean difference Padwal et al. Int J Obes 2003;27:1437
Effect of Continuous vs Intermittent Subutramine Therapy on Body Weight Placebo Intermittent sibutramine Continuous sibutramine Body Weight Change (kg) Run-in period 0 4 8 12 16 20 24 28 32 36 40 44 48 Time (wk) Sibutramine dose=15 mg/d. Wirth and Krause. JAMA 2001;286:1331.
Adverse Effects of Sibutramine Therapy Meridia™ Package Insert, 2001.
Effect of Continuous and Intermittent Phentermine Therapy on Body Weight Continuous Dummy Weight Loss (lbs) ContinuousPhentermine Alternate Phentermine and Dummy QOM 0 4 8 12 16 20 24 28 32 36 Time (weeks) Munro JF et al. Brit Med J 1:352, 1968
External factors Emotions, Drugs Food characteristics Lifestyle behaviors Environmental cues + + Regulation of Food Intake Brain Central Signals Stimulate Inibit NPY AGRP galanin Orexin-A Dynorphin ECS/CB1 α-MSH CRH/UCN GLP-I CART NE 5-HT Peripheral signals Peripheral organs Glucose CCK, GLP-1,Apo-A-IVVagal afferents Insulin GhrelinLeptinCortisol Gastrointestinaltract FoodIntake Adiposetissue Adrenal glands
Vagus nerve Ghrelin Leptin Insulin Amylin Glucagon PYY GLP-1 CCK Gastrointestinal Peptides Hormones food intake regulation Anti-obesity potential digestion and metabolism Anti-diabetes potential Modified from Marx, Science 2003 February 7; 299: 846-849. (in News)
GLP-1 • GLP-1: incretin hormone • Exenatide (Byetta); incretin mimetic • Enhances insulin secretion • Suppresses elevated glucagon secretion • Reduces food intake and body weight • Slows gastric emptying • Increase in beta-cell mass Toft-Nielsen M, et al. J Clin Endocrinol Metab 2001; 86:3717-3723 Drucker DJ. Mol Endocrinol 2003; 17:161-171 Nielsen LL, et al. Reg Pept 2004; 117:77-88
Area Postrema: • part of dorsal vagal complex • chemoreceptive (no BBB) • site of neural integration • bi-directional projections to the GI tract (via vagal afferents and efferents) • bi-directional projections to the hypothalamus, amygdala and other regions Neuroendocrinology of Food Intake RegulationHindbrain as a Target for Peripheral Satiety Signals Hypothalamus ARC NTS/AP Vagus Spinalnerves CCK GI tract Leptin Insulin Amylin other circulating gut peptides PYY Ghrelin Modified from Marx, Science 2003 February 7; 299: 846-849. (in News)
Open-Label Extension – Combined BYETTA Continued to Reduce Weight
Safety and Tolerability Exenatide Open-Label Extensions • Exenatide generally well tolerated • Adverse events • Nausea (30-40%) • Diarrhea (7%) • Vomiting (9%) • Feeling jittery (5%) • Dizziness (3%) • Headache (3%)
Amylin:A Neuroendocrine Hormone Amylin ReceptorIdentified N N Amylin Binding Sites in the Brain Dorsale Raphe C C RAMP 1 or 3 CTR Nucleus Accumbens Area Postrema Beaumont K, et al. Mol Pharm 1993; 44:493-497 Adapted from Muff R, et al. Endocrinology1999; 140:2924-2927
Placebo + Insulin 120 µg Pramlintide Placebo + Insulin (N=284; Baseline A1C 9.3%) 120 µg Pramlintide BID Dose + Insulin (N=292;Baseline A1C 9.1%) Effects of Pramlintide in Type 2 Diabetes Pooled 120 µg BID Pramlintide Intent to Treat Populations Change in Insulin Use (%) Change in Weight (lb) Change in A1C (%) Week 4 Week 13 Week 26 Week 4 Week 13 Week 26 Week 4 Week 13 Week 26 2.5 6 0 2.0 5 -0.1 1.5 4 -0.2 1.0 3 0.5 -0.3 2 0 -0.4 -0.5 1 -0.5 -1.0 0 -1.5 -0.6 -1 -2.0 -0.7 -2 -2.5 -3 -0.8 -3.0 Data on file, Amylin Pharmaceuticals, Inc.
Hypothalamus Hunger/satiety 27 Endocannabinoid System (CB-1) as a Potential Target of Action for Modulation of Energy Homeostasis and Obesity Energy Balance Feeding Behavior Gastric emptying GI motility Limbic forebrain Motivation for palatable food Ghrelin, PYY Hepatic Lipogenesis Adipose Tissue Metabolism Glucose Homeostasis Lipolysis Lipogenesis Hepatic glucose output Lipogenesis Glucose uptake Glucose, lipid oxidation
28 The ECS is Overactivated in: • Animal models of genetic obesity • Animal models of diet-induced obesity • Human obesity
29 Endocannabinoids Stimulate Food Intake in Mice Anandamide 0.001 mg/kg Vehicle *P<0.05; **P<0.01 vs vehicle 7 6 5 4 3 * * Food intake (grams/day) ** * 1 3 5 7 Day Hao S et al. Eur J Pharmacology. 2000; 392:147-156.
30 The ECS is Upregulated in Human Obesity * P<0.05 vs lean women Engeli S, et al. Diabetes 2005;54:2838–2843.
31 A Mutation in the Enzyme That Degrades Endocannabinoids is Associated with Increased BMI Percent of subjects with FAAH 385 A/A genotype by BMI category * vs normal BMI Caucasians African Americans 16 14 12 10 8 5 4 10 8 6 4 2 0 P<0.05* P<0.01* P<0.05* % of subjects with FAAH 385 A/A 18.5-24.9 25.0-29.9 >30.0 18.5-24.9 25.0-29.9 >30.0 BMI (kg/m2) BMI (kg/m2) Sipe JC et al. Int J Obes Relat Metab Disord.2005;29:755-759.
32 CB1 Blockade Produces a Dose-Related Reduction in Food Intake in Mice 2.0 1.5 1.0 0.5 0.0 Food intake (g) 0.0 0.3 1.0 3.0 10.0 Rimonabant Dose (mg/kg-1) Wiley JL et al. Br J Pharmacol. 2005;145:293-300.
33 Supporting Evidence: • Adipose tissue metabolism • EC stimulation with CB1 agonist increases adipose tissue LPL expression while CB1 blockade inhibits this effect • CB1 stimulation reduces while blockade increases adiponectin synthesis • CB1 blockade reverses the histological changes in adipose tissue produced by diet-induced obesity • EC stimulation reduces the expression of AMP kinase in visceral fat Cota D et al. J Clin Invest. 2003;112:423. Matias I, et al. XV ICRS Symposium June 24-27, 2005; Clearwater, Fla.Jbilo O, et al. FASEB J. 2005;19:1567-1569.
34 StandardDiet High Fat Diet High Fat Diet + Rimonabant The Peripheral ECS in Adipose Tissue Adipose tissue of obese mice fed a high fat diet (HFD) plus rimonabant resembles that of lean mice fed a standard diet (STD) Jbilo O, et al. FASEB J. 2005;19:1567-1569.
35 ECS Stimulation, Centrally and Peripherally, Favors Metabolic Processes that Lead to: • Weight Gain • Lipogenesis • Insulin Resistance • Dyslipidemia • Impaired Glucose Homeostasis
Population Design Study N=6627 Obese Obese or or overweight overweight 3040 1+1 1+1 year year with with / / without without comorbidities comorbidities Rerandomized Re ( ( excluding excluding diabetes diabetes ) ) Obese Obese or or overweight overweight 1507 2 2 years years with with / / without without comorbidities comorbidities ( ( excluding excluding diabetes diabetes ) ) 1 year year Obese Obese or or overweight overweight with with 1033 u u ntreated ntreated dyslipidemia ( ( excluding excluding diabetes diabetes ) ) 1 1 year year Obese Obese or or overweight overweight with with type type 1047 2 2 diabetes diabetes 36 RIO: Rimonabant In Overweight/ObesityCB-1 Blockade in Human Studies (>6600 patients enrolled) 1 Pi-Sunyer FX.Obes Res. 2004;12(suppl):08-OR, A27.
Placebo Rimonabant 20 mg 37 RIO-Europe and RIO-Lipids: Weight Change at 1 Year Completers ITT (LOCF) 0 -1.5 -2.3 -2 -1.8 Placebo Rimonabant 20 mg -4 Weight change (kg) -3.6 -6 -6.6 -8.6 -6.9 -8 -8.6 -10 0 16 32 • ITT • LOCF Weeks Van Gaal et al. The Lancet 2005; 365: 1389-97. Despres J-P, et al. N Engl J Med. 2005;353:2121-2134.
0 -2.3 kg ± 0.5 -2 -3.2 kg ± 0.4 -4 Weight change (Kg) -6 -7.4 kg ± 0.4 -8 -10 0 8 16 24 32 40 48 56 64 72 80 88 96 104 LOCF Weeks 38 RIO-NA: Weight Change over 2-Years in Re-randomized Patients Placebo ITT (LOCF) Rimonabant 20 mg/PLB Rimonabant 20 mg Weight (kg) Change from Baseline over 2 Years (Mean +/- SEM) Pi-Sunyer FX et al. JAMA 2006;295:761-775.
Placebo Rimonabant 5 mg Rimonabant 20 mg 15 10 +6.6% +14.1% p<0.001 5 +4.0% ns +8.4%ns -1.9%p<0.001 -5 0 +7.8% -10 0 24 48 72 104 LOCF LOCF 39 RIO-NA: HDL-C and TG over 2 Years* *Patients on same treatment for 2 years ITT, LOCF HDL-cholesterol Triglycerides 30 25 20 Change in Triglycerides (%) Change in HDL-cholesterol (%) 15 10 5 -15 0 0 24 48 72 104 Weeks Weeks Pi-Sunyer FX et al. JAMA 2006;295:761-775.
40 RIO-Lipids: Percent Change in HDL-C and TG Levels at 1 Year Rimonabant 20 mg Rimonabant 5 mg Placebo Completers 10 5 0 -5 -10 -15 -20 30 25 20 15 10 5 0 P<0.001 22.9 +0.4 P=0.017 Change in TG (%) Change in HDL-C (%) -3.6 15.6 11.8 P<0.001 -15.7 0 12 24 36 52 Week 0 12 24 36 52 Week ITT, LOCF Placebo : 11. 8% R5 mg : 14.2% (ns v. placebo) R20 mg : 19.1% (p< 0.001 v. placebo) Placebo : 0.0. % R5 mg : 1.2% R20 mg :-12.6% (p < 0.001 v. placebo) Despres J-P, et al. N Engl J Med. 2005;353:2121-2134.
RIO-DIABETESResults: Weight Changes Scheen A. Late Breaking Clinical Trials. ADA Scientific Session 2005.
42 RIO-NA: Overall Safety Year 1 Rimonabant Rimonabant Placebo n = 607 5 mg n = 1214 20 mg n = 1219 Overall discontinuations 49.0 % 44.9 % 49.1 % Subjects with any adverse event 82.0 % 83.4 % 85.5 % Subjects with any serious adverse event 3.5 % 3.8 % 4.5 % Subjects discontinued due to adverse event 7.2 % 9.4 % 12.8 % Pi-Sunyer FX et al. JAMA 2006;295:761-775.
43 RIO-NA: Adverse Events LeadingTo Drug Discontinuation in Year 1 According to MedDRA, in any rimonabant groups : in main SOCs (>=1% ) and in at least 6 patients (0.5%). One patient may report several events Pi-Sunyer FX et al. JAMA 2006;295:761-775.
44 RIO-NA: Main Adverse Events Leading to Drug Discontinuation in Year 2* Placebo Rimonabant (N=298)N (%) 5 mg (N=300)N (%) 20 mg (N=333)N (%) Psychiatric disorders 4 (1.3) 6 (2.0) 7 (2.1) Depressed mood disorders 3 (1.0) 4 (1.3) 4 (1.2) Anxiety 0 (0) 1 (0.3) 2 (0.6) *Patients receiving the same treatment for 2 years Pi-Sunyer FX et al. JAMA 2006;295:761-775.
Conclusions • Obesity is a chronic disease • Modest weight loss (5% -10% of body weight) can have considerable medical benefits • Lifestyle change (diet and physical activity) is the cornerstone of therapy • Pharmacotherapy can be useful in properly selected patients • Bariatric surgery is the most effective therapy for severe obesity
Obese Patients Have Unrealistic Weight Loss Goals Foster et al. J Consult Clin Psychol 1997;65:79.