
Uploaded by
amish
1 SLIDES
103 VUES
10LIKES
Calcium Ion Changes in Milk Fermentation Process
DESCRIPTION
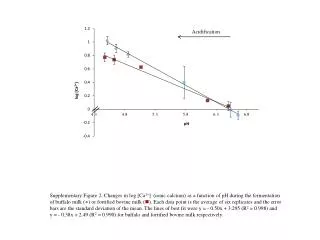
This figure shows the variation in log [Ca2+] with pH during fermentation of buffalo milk and fortified bovine milk. Data are averages of six replicates. Lines of best fit are provided for each.
Download
1 / 1
Download Presentation

Télécharger la présentation
Calcium Ion Changes in Milk Fermentation Process
An Image/Link below is provided (as is) to download presentation
Download Policy: Content on the Website is provided to you AS IS for your information and personal use and may not be sold / licensed / shared on other websites without getting consent from its author.
Content is provided to you AS IS for your information and personal use only.
Download presentation by click this link.
While downloading, if for some reason you are not able to download a presentation, the publisher may have deleted the file from their server.
During download, if you can't get a presentation, the file might be deleted by the publisher.
E N D
Presentation Transcript
Acidification Supplementary Figure 2. Changes in log [Ca2+] (ionic calcium) as a function of pH during the fermentation of buffalo milk (●) or fortified bovine milk (). Each data point is the average of six replicates and the error bars are the standard deviation of the mean. The lines of best fit were y = - 0.50x + 3.295 (R2 = 0.998) and y = - 0.38x + 2.49 (R2 = 0.990) for buffalo and fortified bovine milk respectively.


More Related
Audio
Live Player