Cumulative Distribution of MLM p-values for Different Marker Combinations Impacting Agricultural Traits
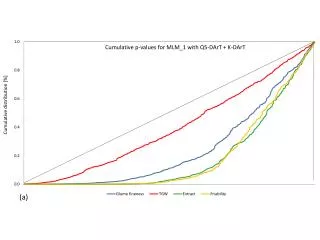
This study analyzes the cumulative p-values for MLM models with various marker combinations impacting agricultural traits. Electronic Supplementary Material Fig. 4 illustrates the cumulative distribution of observed p-values for MLM models with different marker types used for population structure and kinship information. The study considered traits such as Glume fineness, Thousand Grain Weight (TGW), extract, and friability. The cumulative p-values for MLM models with Q5-DArT, Q5-SSR, K-DArT, and K-SSR combinations are compared and presented graphically, providing insights into the significance of marker types on trait variation.

Cumulative Distribution of MLM p-values for Different Marker Combinations Impacting Agricultural Traits
E N D
Presentation Transcript
Cumulative p-values for MLM_1 with Q5-DArT + K-DArT Cumulative distribution [%] (a)
Cumulative p-values for MLM_2 with Q5-SSR + K-DArT Cumulative distribution [%] (b)
Cumulative p-values for MLM_3 with Q5-DArT + K-SSR Cumulative distribution [%] (c)
Cumulative p-values for MLM_4 with Q5-SSR + K-SSR Cumulative distribution [%] (d)
Electronic Supplementary Material Fig. 4 Cumulative distribution of the observed p-values assessed for different variants of the MLM_QK with respect to the marker type used for assessing population structure and kinship information (a) MLM_1 = Q5-DArT + K-DArT, (b) MLM_2 = Q5-SSR + K-DArT, (c) MLM_3 = Q5-DArT + K-SSR, (d) MLM_4 = Q5-SSR + K-SSR). Following traits were considered: Glume fineness, thousand grain weight (TGW), extract, and friability.