Download

1 / 42
610 likes | 990 Vues
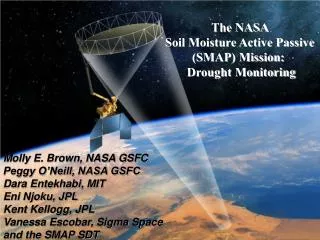
NASA’s Soil Moisture Active Passive (SMAP) Mission. Peggy O’Neill, NASA GSFC SMAP Deputy Project Scientist. SMAP-GPM Joint Mission Teacher Workshop GSFC Visitor’s Center June 26, 2013. Water is Important !. . . . and is part of the Earth’s integrated

E N D
NASA’s Soil Moisture Active Passive (SMAP) Mission Peggy O’Neill, NASA GSFC SMAP Deputy Project Scientist SMAP-GPM Joint Mission Teacher Workshop GSFC Visitor’s Center June 26, 2013
Water is Important! . . . and is part of the Earth’s integrated physical system. Water is Vital for Life Soil moisture is an important part of this system: Soil moisture controls the amount of rain which infiltrates into the soil vs running off into streams, and provides feedback between the land and atmosphere [WATER CYCLE] 2. Soil moisture impacts the growth of vegetation, and its freeze/thaw state affects the length of the growing season [CARBON CYCLE] 3. Soil moisture influences the exchange of latent & sensible heat energy between the land surface and the atmosphere [ENERGY CYCLE]
What is Soil Moisture? 1 m 1 m 1 m very wet ... very dry ... Soil Moisture = _Volume of water_____ Volume of soil matrix Units are cm3 / cm3 or m3 / m3 [sometimes %] Ex. Volumetric soil moisture = 0.25 cm3/cm3or 0.25 m3/m3 or 25%
Soil Moisture is Variable Soil moisture varies with space and time. Primary factors that influence the distribution of soil moisture are: Rainfall Vegetation Soil Texture Topography
How might soil moisture influence air temperature? …causing soil moisture to increase... Precipitation wets the surface... …which, through evaporative cooling, leads to cooler temperatures during subsequent days and weeks. …which causes evaporation to increase during subsequent days and weeks... OR the opposite, where no precipitation wets the surface and air temperatures increase ...
Human Health Application European heatwave cause 35,000 deaths, New Scientist, Oct. 2003. Seasonal Climate Prediction: 50 km Resolution Initialize root zone moisture Fischer et al. (2007), J. of Climate, 20.
How might soil moisture influence precipitation? …which affects the overlying atmosphere (the boundary layer structure, humidity, etc.) ... …thereby (maybe) inducing additional precipitation …which causes evaporation to increase during subsequent days and weeks... Precipitation wets the surface... …causing soil moisture to increase...
Value of Soil Moisture Data to Weather &Climate New space-based soil moisture observations and data assimilation modeling can improve forecasts of local storms and seasonal climate anomalies NWP Rainfall Prediction Seasonal Climate Predictability Predictability of seasonal climate is dependent on boundary conditions such as sea surface temperature (SST) and soil moisture – soil moisture is particularly important over continental interiors. Difference in Summer Rainfall: 1993 (flood) minus 1988 (drought) years Buffalo Creek Basin Observed Rainfall 0000Z to 0400Z 13/7/96 (Chen et al., 2001) Without Realistic Soil Moisture Observations 24-Hours Ahead High-Resolution Atmospheric Model Forecasts Prediction driven by SST and soil moisture Prediction driven just by SST With Realistic Soil Moisture High resolution soil moisture data will improve numerical weather prediction (NWP) over continents by accurately initializing land surface states (Schubert et al., 2002) -5 0 +5 Rainfall Difference [mm/day]
Applications of Soil Moisture Better/enhanced weather & climate forecasting More accurate agriculture productivity Drought early warning Extent of flooding (prediction & monitoring) Human healthand vector borne disease
Applications of Soil Moisture (2) Trafficability -- farming, military, and disaster relief operations Insurance sector / flood risk Dust storms Sea Ice (obviously not soil moisture but SMAP microwave measurements are useful) Famine early warning
Direct Measurements Lacking Globally Gravimetric soil sampling is often used, but is labor intensive and spatial coverage is limited In situ measurements (direct/point measurements) Support scale 10 – 50 cm Theta Probe USDA SCAN soil moisture network across United States
Provides all-weather, day-night, large-area measurement capability Strong theoretical basis for measurement of soil moisture based on the large change in the soil dielectric constant with moisture L band frequency (1.4 GHz or 21 cm wavelength) most sensitive to soil moisture while minimizing secondary effects of vegetation and surface roughness Responds most strongly to soil moisture in the 0-5 cm surface layer (average soil under average conditions) MICROWAVE REMOTE SENSING
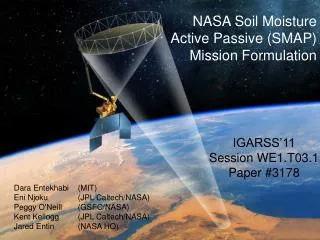
Mission Context SMAP was initiated by NASA as a new start mission in February 2008 SMAP is a joint missionby GSFC and JPL, with project management responsibility at JPL SMAP in currently in Phase D – Integration & Test Target launch date for SMAP is October 2014 SMAP is one of four Tier-1 missions recommended by the U.S. NRC Earth Science Decadal Survey “Earth Science and Applications from Space: National Imperatives for the next Decade and Beyond” (National Research Council, 2007) http://www.nap.edu
Science Objectives SMAP will provide high-resolution, frequent-revisit global mapping of soil moisture and freeze/thaw state to enable science and applications users to: Model simulation of SMAP L4 Soil Moisture Product • Understand processes that link the terrestrial water, energy and carbon cycles • Estimate global water and energy fluxes at the land surface • Quantify net carbon flux in boreal landscapes • Enhance weather and climate forecast skill • Develop improved flood prediction and drought monitoring capability Regions where soil moisture retrieval is limited (dense vegetation, topography, snow/ice) SMAP data will also be used in applications of societal benefit that range from agriculture to human health.
Instruments: Radiometer: L-band (1.4 GHz) V, H, 3rd & 4th Stokes parameters 40 km resolution Moderate resolution soil moisture (high accuracy ) Radar: L-band (1.26 GHz) VV, HH, HV polarizations 1-3 km resolution (SAR mode); 30 x 5 km resolution (real-aperture mode) High resolution soil moisture (moderate accuracy) and Freeze/Thaw state detection Shared Antenna 6-m diameter deployable mesh antenna Conical scan at 14.6 rpm Constant incidence angle: 40 degrees -- 1000 km-wide swath -- Swath and orbit enable 2-3 day global revisit Orbit: -- Sun-synchronous, 6 am/pm, 685 km altitude -- 8-day exact repeat Mission Operations: --3-year baseline mission -- Launch target is October 2014 Measurement Approach
Instrument Overview Spun instrument assembly Radiometer is spun-side mounted to reduce losses Radar is fixed-mounted to reduce spun inertia • Radiometer • Provided by GSFC • Leverages off Aquarius radiometer design • Includes RFI mitigation (spectral filtering) • Common 6 m spinning reflector • Enables global coverage in 2-3 days • Spin Assembly (provided by Boeing) and Reflector Boom Assembly (provided by NGST-Astro) have extensive heritage • Radar • Provided by JPL • Leverages off past JPL L-band science radar designs • RFI mitigation through tunable frequencies & ground processing
SMAP Data Products * Over outer 70% of swath ** The SMAP Project will make a best effort to reduce the data latencies beyond those shown in this table.
36 km SMAP Spatial Grids (a) Perfect nesting in SMAP EASE grids • All SMAP baseline products will be output on • one of the SMAP standard EASE2* grids • SMAP grids are perfectly nested to facilitate • working between different products at • different scales • * Equal-Area Scalable Earth-2 grid (b) Example of ancillary NDVI climatology data displayed on the SMAP 36-km, 9-km, and 3-km EASE grids
SMAP Mission Summary (1) • SMAP is a planned NASA Earth Science Decadal Survey Mission • Launch currently scheduled for October 2014 into a 6 am / 6 pm • sun-synchronous orbit for a planned 3-year mission • Will use an L-band radar & radiometer to measure global soil • moisture & freeze/thaw every 2-3 days • Baseline SMAP data products include: • -- radar-derived F/T at 3 km resolution • -- radiometer-only SM at 40 km resolution • -- combined radar/radiometer SM at 9 km resolution • -- value-added products (root zone SM, carbon NEE) at 9 km • All SMAP products output on nested 3, 9, 36 km EASE2 grids
Summary (2) • SMAP provides high-resolution and frequent-revisit global mapping of soil moisture and freeze/thaw state that has: • Science value for Water, Carbon and Energy Cycles • Applications in Operational Weather Forecasting, Flood & Drought Monitoring, Agriculture, & other areas of benefit to society • Addresses priority questions on Climate and Climate Change • Leverages Hydros, Aquarius, and SMOS risk reduction, expertise, and • lessons learned • Project is currently in Phase D – Integration & Test of Flight Hardware • Provides synergism with GPM • -- SMAP provides GPM with a better land surface background for improved • estimation of rainfall over land • -- GPM provides SMAP with better rainfall input into land surface models and • a potential rain flag needed in the soil moisture retrievals • Project has and will continue to reach out to the broad science, EPO, • and applications communities
Significant Events (GSFC) FM Radiometer: LN2 Bucket Test
Significant Events (GSFC) Radiometer System at TVAC Chamber 239 for Testing
Significant Progress (JPL) Post-Ship Setup and Test – May 6-10, 2013
Interested in joining a SMAP Working Group? • Sign up at http://smap.jpl.nasa.gov/science/wgroups • Algorithms Working Group (AWG) • Calibration & Validation Working Group (CVWG) • Radio-Frequency Interference Working Group (RFIWG) • Applications Working Group (AppWG)
Anthropogenic Radio-Frequency Interference (RFI) RFI is evident and wide-spread (Data from SMOS) SMAP is taking aggressive measures to detect and mitigate RFI in its instrument and data processing designs.
Cal/Val Objectives • Pre-Launch objectives: • Acquire and process data with which to calibrate, test, and improve models and algorithms used for retrieving SMAP science data products • Develop and test the infrastructure and protocols for post-launch validation; this includes establishing an in situ observation strategy for the post-launch phase • Post-Launch objectives: • Verify and improve the performance of the science algorithms • Validate accuracies of the science data products as specified in L1 Requirements (1) North of 45N latitude
Algorithm Needs • All baseline SMAP products have associated algorithm(s) which • require a variety of ancillary data to meet retrieval accuracies: • -- 0.04 cm3/cm3 for soil moisture within SMAP land mask • -- 80% classification accuracy for binary F/T in boreal latitudes • Areas of snow/ice, frozen ground, mountainous topography, open • water, urban areas, and dense vegetation (> 5 kg/m2) are excluded • from SM accuracy statistics • Static ancillary data do not change during mission • -- permanent masks (land/water/forest/urban/mountain), DEM, soils • Dynamic ancillary data require periodic updates ranging from daily • to seasonally • -- soil T, precipitation, vegetation, surface roughness, land cover
Ancillary Parameter Choices Anticipated Primary Sources of Ancillary Parameters
Flood and Drought Applications Current: Empirical Soil Moisture Indices Based on Rainfall and Air Temperature (By Counties >40 km and Climate Divisions >55 km ) Future: SMAP Soil Moisture Direct Observations of Soil Moisture at 9 km
Carbon Budget in Boreal Landscapes Normal to late thaw (May): Carbon Source [1995, 1996, 1997] Early thaw (April 22): Carbon Sink [1998] 5/7 5/27 5/26 4/22 Spring thaw dates A given location can be a net source or net sink of carbon, depending on freeze / thaw date. SMAP freeze / thaw measurements can help reduce errors in the closing of the carbon budget. Goulden et al., 1998: Sensitivity of Boreal Forest Carbon Balance to Soil Thaw, Science, 279. Herring, D. and R. Kannenberg: The mystery of the missing carbon, NASA Earth Observatory.
SMAP Level 1 Science Requirements (1) volumetric soil moisture content (1-sigma) ; % classification accuracy (binary Freeze/Thaw) (2) North of 45⁰ N latitude Mission Duration Requirement: 3 Years Baseline; 18 Months Threshold Derived from models and decision-support tools used in areas of application identified by decadal survey for SMAP
SMAP Temporal Resolution & Latency • SMAP Level 2 soil moisture data are output on a half-orbit basis representing • an instantaneous soil moisture value for the 0-5 cm surface layer at 6 am • local time • -- a 6 pm soil moisture product may be produced if resources permit • Level 3 soil moisture data are just global maps of all 6-am half orbit data in a • 24-hr period • -- L3_FT data incorporate both 6 am & 6 pm data to document daily F/T transitions • L4_SM includes a model-generated 0-5 cm and 0-100 cm soil moisture Latencies: -- 12 hrs for L1 data -- 24 hrs for L2 data -- 50 hrs for L3 data -- 7 days for L4_SM -- 14 days for L4_C Simulation of L3_SM_P retrieved surface volumetric soil moisture in cm3/cm3
Synergistic Data and Experience from SMOS and Aquarius • SMAP complements SMOS and Aquarius: • Extends global L-band radiometry beyond these missions (yields long-duration land hydroclimate soil moisture datasets) • Significantly increases the spatial resolution of soil moisture data • Adds characterization of freeze thaw state for carbon cycle science • Adds substantial instrument and processing mitigations to reduce science degradation and loss from terrestrial RFI • SMAP benefits from strong mutual science team members’ engagements in missions • SMOS & Aquarius data are important for SMAP’s algorithm development • SMAP will collaborate in and extend SMOS & Aquarius Cal-Val campaigns • SMOS and Aquarius will provide valuable data on the global terrestrial RFI environment which is useful to SMAP SMOS (ESA) 2009 Launch Aquarius 2011 Launch SMAP 2014 LRD