Sensor Network Security: Actuation Attacks and the Possible Outcomes
Sensor Network Security: Actuation Attacks and the Possible Outcomes Whitney Longsine, Graduate Advisor: Alexandra Czarlinska, Faculty Advisor: Dr. Deepa Kundur. Texas A&M Department of Electrical and Computer Engineering. Introduction. Sample MATLAB code and Simulation Iteration.

Sensor Network Security: Actuation Attacks and the Possible Outcomes
E N D
Presentation Transcript
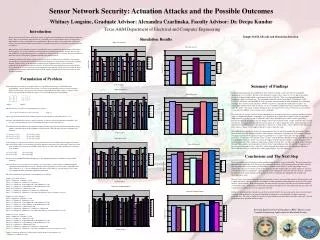
Sensor Network Security: Actuation Attacks and the Possible Outcomes Whitney Longsine, Graduate Advisor: Alexandra Czarlinska, Faculty Advisor: Dr. Deepa Kundur Texas A&M Department of Electrical and Computer Engineering Introduction Sample MATLAB code and Simulation Iteration Wireless sensor networks can be utilized in a variety of applications, including uses in the military, health, and home. They are an attractive option because of a potentially low cost which allows them to be deployed in large numbers to survey a particular area or phenomenon. However, there are presently many security and resource issues associated with the networks that need attention and further research before practical networks are realized. Many security attacks common to wireless networks have been researched and corresponding defenses have been suggested. Yet, because wireless sensor networks are a relatively new, unique concept, there are new attacks that have no prior knowledge base to pull from for defense strategies. A recently discovered method of attack that can be used against a legitimate network is the actuation attack. Actuation is defined as the ability of node to change, act upon, or influence its environment. Our research concerns the use of actuation by a malicious node and/or network to corrupt the data sensed by the legitimate network. If the accuracy of the information collected by the legitimate wireless sensor network is compromised, the network has failed its objective. In order to investigate what can be done to prevent this loss of data fidelity, we must first look into the magnitude of the attack itself. We need to research the worst possible actuation attack a malicious network can make against a legitimate network given certain cost and detection constraints. Simulation Results Formulation of Problem Summary of Findings To determine the worst attack, we employed the use of optimization techniques, specifically linear programming. Grid A, shown below, models a section of an area in which a wireless sensor network is deployed. Analyzing a 2x2 grid, we focused on the actuation in the left most section, or squares 1 and 3. We let x[j] represent the actuation in square j=1,2,3,4; Grid B shows this representation. Grid A Grid B The function we were interested in maximizing is as follows: Z= a1*x[1] + a2*x[2] + a3*x[3] + a4*x[4] (Eqn. 1) where a[j] represents the malicious network's interest in actuating the specific grid point j=1,2,3,4. Of course, this function was subject to many constraints, as wireless sensor networks have limitations. The two types of constraints present in our formulation are those of detection and cost. To avoid detection, the difference in actuation of squares k and m must not exceed some constant value ε[k,m], which is a threshold given by the legitimate sensing network. The following detection constraints were included: (1) |x1-x2| ≤ ε [1,2] (4) |x2-x3| ≤ ε [2,3] (2) |x1-x3| ≤ ε [1,3] (5) |x2-x4| ≤ ε [2,4] (3) |x1-x4| ≤ ε [1,4] (6) |x3-x4| ≤ ε [3,4] Cost of energy is a big concern in wireless sensor networks because of the limited power supply of each node. Thus, the product of the cost of actuating c[j] and the amount of actuation x[j] in each square j must not exceed some constant C[j], which is the available energy allocate for such a task. The following cost constraints were included: (1) c1*x1 ≤C[1] (3) c3*x3 ≤C[3] (2) c2*x2 ≤C[2] (4) c4*x4 ≤C[4] We chose to use the MATLAB function linprog() in the optimization toolbox to simulate several possible situations. Since we chose to focus our interests on squares 1 and 3 in the grid, we kept a2=a4=1 constant through all experiments and manipulated a1 and a3. Throughout the experiments, a1 and a3 always shared the same value, either 10, 2, or 1.We also manipulated the values of c[j] and C[j], for each square j=1,2,3,4 and even eliminated certain constraints in different simulations. The individual simulation parameters and conditions are as follows: Graph 1: a1=a3=10, a2=a4=1 Sim1: c-Variance=2, c-Mean=5, C=10 Sim 5-1: c-Variance=5, c-Mean=5, C=10 (errors) Sim 5-4: c-Variance=2, c1&c3-Mean=10, c2&c4-Mean=5, C=10 Sim 5-7: c-Variance=2, c1&c3-Mean=5, c2&c4-Mean=10, C=10 Sim 5-10: c-Variance=5, c-Mean=10, C=10 Sim 6-1: c-Variance=2, c-Mean=5, C-Variance=2, C-Mean=10 Sim 7-1: c-Variance=2, c-Mean=5, C=10, omit constraints |x1-x4|≤ ε1,4 and |x2-x3|≤ ε2,3 Graph 2: a1=a3=2, a2=a4=1 Sim2: c-Variance=2, c-Mean=5, C=10 Sim 5-2: c-Variance=5, c-Mean=5, C=10 Sim 5-5: c-Variance=2, c1&c3-Mean=10, c2&c4-Mean=5, C=10 Sim 5-8: c-Variance=2, c1&c3-Mean=5, c2&c4-Mean=10, C=10 Sim 5-11: c-Variance=5, c-Mean=10, C=10 Sim 6-2: c-Variance=2, c-Mean=5, C-Variance=2, C-Mean=10 Sim 7-2: c-Variance=2, c-Mean=5, C=10, omit constraints |x1-x4|≤ ε1,4 and |x2-x3|≤ ε2,3 Graph 3: a1=a3=1, a2=a4=1 Sim4: c-Variance=2, c-Mean=5, C=10 Sim 5-3: c-Variance=5, c-Mean=5, C=10 Sim 5-6: c-Variance=2, c1&c3-Mean=10, c2&c4-Mean=5, C=10 Sim 5-9: c-Variance=2, c1&c3-Mean=5, c2&c4-Mean=10, C=10 Sim 5-12: c-Variance=5, c-Mean=10, C=10 Sim 6-3: c-Variance=2, c-Mean=5, C-Variance=2, C-Mean=10 Sim 7-3: c-Variance=2, c-Mean=5, C=10, omit constraints |x1-x4|≤ ε1,4 and |x2-x3|≤ ε2,3 Graph 4: Sensitivity Analysis, a1 and a3 increase from 10 to 11 in increments of .1 c-Variance=2, c-Mean=5, C=10 Each individual simulation was compiled ten times and the resulting x values and fval, the maximized optimization, were recorded. In terms of the optimized variables, the x values x1, x2, x3, and x4 are almost always there upper bounds which are determined by x[j] ≤ C[j]/c[j]. There are a few exceptions in the simulations, though seemingly rare. The maximum recorded Z resulted from Sim 5-1 (Iteration 6), with Z=96.6719. However, since the RHS of every constraint (for all iterations of each simulation) were generated randomly, these results are not conclusive. We do see, however, that when the coefficients a1 and a3 are significantly reduced, the Z value is reduced. So, it is reasonable to surmise that larger coefficients produce larger Zs. (Note: Constraints of Sim n: Iteration m were not carried over to Sim n+1: Iteration m; instead they were generated randomly every iteration, every simulation.) The results for the x values and fval of each simulation were averaged across the ten iterations and those average values are displayed in Figures 1 through 4. It is obvious in these graphs that a1 and a3 values of 10 produce much larger Zs (fval) than a1 and a3 values of 2 and 1, thus showing larger a1 and a3 values significantly increase the effect of actuation in the area. Figure 4 shows the sensitivity of the x values and fval to these a1 and a3 values by increasing them from 10 to 11 in increments of .1 and averaging the results. From the graph we see somewhat of a gradual increase in the fval values, which is less visible in the x values. However, the changes in these values are minor, which suggests that the system is relatively stable. The results are less conclusive in terms of what parameters for c[j]s and C[j]s produce the optimized Z values. The fval data across the multiple a1 and a3 values (Figures 1 through 3) is inconsistent. For example, in Figure 1(b), Sim 5-1 produced the highest average fval, and Sims 5-1, 5-2 and 5-3 have the same c[j] and C[j] parameters, yet in Figures 2(b) and 3(b), Sims 5-2 and 5-3 do not produce the highest average fval. However, the fvals produced in Sims 5-2 and 5-3 are among the highest in their respective samples, so there do appear to be some trends present. This tendency is shown more clearly in Sims 5-10, 5-11, and 5-12, which all have the same c[j] and C[j] parameters and all produce the lowest fval average in Figures 1(b), 2(b) and 3(b). It appears as if the c[j] and C[j] parameters have some effect on the data and these trends are visible, though not definitive. These tendencies are less visible in the x value graphs (Figures 1(a), 2(a), and 3(a)). Conclusions and The Next Step These simulations gave us insight into what conditions would lead to a successful attack. The greater interest an attacker has on a particular area, the greater the magnitude the attack on that region and thus the entire network. The actuation effect is not sensitive to small changes in interest, thus relatively stable and perhaps easy to control. The effect of cost on the system is somewhat predictable, though much less stable. However, it may be easier for the attacker to manipulate, especially if he is not managing the malicious network remotely. Therefore, the outcome of the attack depends on the attacker’s ability to recognize and manipulate the variables and constraints in his favor. The next step is to research and decide what the legitimate wireless sensor network can do to defend against such a significant attack. One idea is the use of mobility to either randomly or knowledgably relocate the nodes in the wireless sensor network. With rearrangement, the affected node may move out of the area of actuation and thus evade further attack. Additionally, the node may then notice the difference is sensed data and thus may detect the actuation attack and the presence of a malicious network. Further research should also expand the area of the network studied. Our research merely focused on a 2x2 grid sampling, while potential sensor networks should have hundreds or even thousands of nodes surveying a particular area. We need to explore the results of such simulations on much larger networks to truly get a feel for the outcome of an actuation attack in reality. Research Experience for Undergraduates (REU): Electrical and Computer Engineering Applications for Homeland Security