Download
1 / 46
460 likes | 579 Vues
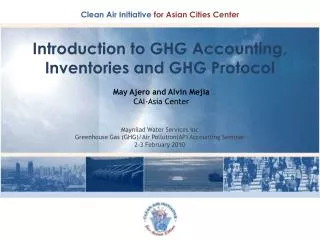
GHG Numbers to Assist in Understanding Controls. What Causes Global Climate Change ?. GHG warming potential. 2004 concentrations. Annual Mean Growth Rate Mauna Loa, Hawaii. What are our options for the future?. With “Business As Usual” CO2 emissions will more than double by 2060

E N D
What are our options for the future? • With “Business As Usual” CO2 emissions will more than double by 2060 • To stabilize CO2 and other GHG levels in the atmosphere [at an “acceptable” level], emissions must be cut to 60-80% of 1990 levels by 2050.*
Numbers on Production and Sequestration and Offset Options for reducing GHG concentrations
Examples • Texas – 261,000 Sq. miles of land area – 167 million acres at 640 acres per sq. mile • Texas forested acres – 17.1 million • Amount of CO2 sequestered annually if first growth – 20-30 million tons • Managed existing growth – 15 million + tons • Total already sequestered – 1.7 billion tons of CO2 – market value – 30-68 billion $
Other States – source World Almanac • Alaska – 120 million forested acres • California – 40.2 million forested acres • Oregon – 29.7 million • Georgia – 24.4 million • Alabama – 23.0 million (MS – 18.4) • Washington – 21.8 million • North Carolina– 19.1 million • Arizona – 19.1 million • Arkansas – 18.8 million • New York – 18.4 million
Maintaining Existing Forest Habitats • Existing habitats that are maintained sequester carbon, but these cannot be registered under most offset and registry programs • As a result they have received only a small percentage of the proceeds going towards carbon sequestration (Conservation International) • Carbon sequestration rates vary by age, location, tree types, soil types, etc. and must be evaluated on a case-by-case basis for these existing forests
Prairie Grasslands • Chicago Climate Exchange (CCX) qualifies all 24 counties in the Greater Houston Region for a 1 ton CO2/acre/yr offset for grasslands • Grasslands must be planted after January 1, 1999 to qualify (restoration back to natural state after conversion to agricultural land) • Regions in the western United States are only estimated and allowed to register for 0.4 tons/acre offsets
Tidal Saline Wetlands (TSWs) • Wetlands generally sequester between 0.33 and 0.49 tons of CO2/acre/yr (net) • TSWs (including salt marshes) • carbon storage potential not as thoroughly studied • known for their exceptional rates of production • large quantity of sulfate contained in their soils= major carbon sequestration advantage • hinders production of methane (CH4), a very potent greenhouse gas emitted by most freshwater and peatland wetlands
Local TSW Sequestration Rates • Studies for the Gulf Coast spartina alterniflora TSWs, measured the rate of CO2 sequestration at: • 1.56 tons of CO2/acre/yr in McFaddin National Wildlife Refuge • 2.03 tons of CO2/acre/yr in Aranasas, Texas • 3.33 tons of CO2/acre/yr in San Bernard, TX • Global average for TSW’s CO2 sequestration is much higher (at 18.23 tons of CO2/yr)
From Sink to Source • Bays and estuaries can’t be “replanted” like other habitats, but their inflows can be maintained to protect this carbon sink and prevent forming a source. • Nueces River Delta near Corpus Christi, Texas, CO2 • exchange of the marsh was evaluated under two different situations— during flooding and dry periods • Of recent, high salinity, low freshwater inflows due to dam construction and diversions • High freshwater inflows after flooding = sequestration at a net rate of up to 73.45 tons of CO2/acre/yr. • Low freshwater inflows during summer = production at a rate between 2.4 tons of CO2/acre/yr and 52.1 tons of CO2/acre/yr.
GHG Production Numbers in context – Harris County, Texas Compare to Sequestration Capability and Use for Understanding of International Negotiations
A Look at Refinery Emissions National Energy Technology Laboratory, “Increasing Security and Reducing Carbon Emissions of the U.S. Transportation Sector: A Transformational Role for Coal with Biomass,” August 24, 2007.
What percentage is from energy use? • Note: This is ignoring emissions from LULUCF- Land use, land-use change, and forestry. A greenhouse gas inventory sector that covers emissions and removals of greenhouse gases resulting from direct human-induced land use, land-use change and forestry activities. • From US UNFCCC Report, 2005.
Each US Citizen . . . • Releases over 20 tons of CO2/yr~ 5 tons of C per year on average. • 4 tons of CO2 equals 1 ton of carbon • In the long run, the globe is limited to 7 GtC/yr, if we estimate that population will only rise 0.2 billion more to 7 billion, than we can estimate a 1 ton C/person, or 3.67 tons of CO2/yr. • This means if the US has 300 million people (lets estimate growth to 350), we should only consume 0.35 GtC, which means a 1.625 -0.35=1.275 GtC (or 4.675 GtCO2) decrease from current US GHG emissions in energy sector.
What if everyone used energy like an American? • Global emissions from energy are 7.835 GtC/yr. The US is 1.625GtC/yr for 300 million people. • If we assume there will soon be 7 billion people, and they all use the same amount of energy as the average American from the same sources and average carbon intensity, the world would be producing 37.92 GtC/yr instead of 7.835 GtC/yr.
To achieve this major decrease in our carbon emissions • Each person must decrease their current consumption from 20 GtCO2/yr to 1.13GtC * (44/12) (GtCO2/GtC)= 4.14 GtCO2 or around 1 ton of C from around 5 tons • This, approximately, 80% cut is a very conservative estimate. Al Gore says we need a 90% reduction in US emissions by 2050, and Oslo’s Climate Change Center suggests a 95% cut from the US.
Stabilization Wedges • Billions of Tons Carbon Emitted per Year • 16 GtC/y • Current path = “ramp” • 16 • Eight “wedges” • Goal: In 50 years, same • global emissions as today • Historical • emissions • 8 • Flat path • 1.6 • 0 • 1950 • 2000 • 2050 • 2100
Nuclear Fission (1) • 15 Wedge Strategies in 4 Categories • Energy Efficiency & • Conservation (4) • 16 GtC/y • Renewable Fuels • & Electricity (4) • Fuel Switching • (1) • Stabilization • Stabilization • Triangle • Triangle • CO2 Capture • & Storage (3) • 8 GtC/y • Forest and Soil Storage (2) • 2007 • 2057