Download
1 / 39
390 likes | 646 Vues
Maximizing Employee Health and Productivity Disease Management Colloquium May 11, 2006 Ron Loeppke, MD, MPH. Integrated Health and Productivity Enhancement. Converging Trends in the Market (When) Clinical/Financial Business Case (Why) Integrated H&P Solutions (What)

E N D
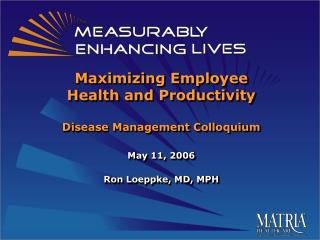
Maximizing Employee Health and ProductivityDisease Management ColloquiumMay 11, 2006Ron Loeppke, MD, MPH
Integrated Health and Productivity Enhancement • Converging Trends in the Market (When) • Clinical/Financial Business Case (Why) • Integrated H&P Solutions (What) • Employer Case Studies (How)
Converging Healthcare Trends Affecting Employers Spiraling costs driven by: • Epidemiologic Trends (aging workforce, BOI/BOR) • Significant quality gaps • Rising unit costs • Complex benefit designs Disconnected/fragmented control levers • Providers, employers, health plans, patients • Current “non-system” too fragmented and uncoordinated Simultaneous Demand side and Supply side opportunities • Employer appetite for more engagement of total population • Consumer movement and Physician Pay for Performance
Corporate Profits vs. Rising Health Benefit Costs All U.S. Corporations $ Billions Source: The National Data Book and IRS Data Reports
The Real Problem: The Full Cost of Employee Illness Personal Health Costs Medical Care Pharmacy Hospitalization Behavioral Health Medical & Pharmacy Costs *$6,020 PEPY 33% Workers’ Comp Medical Costs Salary Continuation *2003 PEPY Avg. Productivity Costs Health-related Productivity Costs $12,000 PEPY Overtime Turnover 66% Absenteeism STD LTD Temporary Staffing Administrative Costs Replacement Training Off-Site Travel for Care Presenteeism Total PEPY = $18,020 Employee DissatisfactionCustomer Dissatisfaction Variable Product Quality Sources: Loeppke, et.al., JOEM, 2003; 45:349-359 and Brady, et.al., JOEM, 1997; 39:224-231
Health and Human Capital “Just as we have a corporate priority on enhancing our financial capital and economic assets of our company, we must have a corporate priority on enhancing the human capital and health assets of our company.” “The health of our workforce is inextricably linked to the productivity of our workforce and therefore the health of our bottom line.”
CFO’s Concern Over Rising Healthcare Costs IBI CFO Study 2005
Linking Health, Productivity & the Bottom Line Source: IBI CFO Study 2005
Ballooning Total Health Costs Tinkering with the peripheral financial transactions of healthcare does notlower TotalCosts—it only shifts costs However… Improving the clinical transactions of healthcare by better managing the burden of illness and reducing health risks does lower Total Costs as well as improves the health and productivity of the workforce. The International Value Proposition
Transforming the System Old Way New Way Focus • Medical Cost Mgt • Quantity/Cost of Service • Illness & Injury • Unaligned Incentives • Total Cost Mgt • Quality/Value of Service • Health and Productivity • Aligned Incentives Approach • Permission to Drs & Pts • Health Benefit Mgt • Fragmentation • Patients are passive recipients • Empowerment of Drs & Pts • Health Care Mgt • Integration / Coordination • Patients are activeparticipants Results • Lacks Patient/MD Rewards for Clinical Results • EEs “Use it or Lose it” • Drs not rewarded for Quality • Employers “Pay for Volume” • Shared Patient/MD Rewards for Clinical Results • EEs “Use Wisely & Save” • Dr. rewarded for Quality Care • Employers “Buy Value”
Integrated Solutions Must Address the Health Continuum Population Health Management 15% members = 85% cost Well At Risk Acute—Self Limiting Chronic Illness Complex Care • Health Risk Assessment • Lifestyle Modification Programs • DiseaseManagement • Empowering Education and Support • Prevention • Screenings • Nurse Advice Line • Web Tools • Complex Case Management • Predictive Modeling D i s a b l i n g C o n d i t i o n s 85% members = 15% cost
Integration With Quality Focus Fragmented - Uncoordinated Integrated - Aligned Integrated Care Health Mgt Employee-- Patient Disease Mgt. HealthMgt. Patient RN/MD EE--Patient Disease Mgt Demand Mgt RX Case Mgt. RN/MD Demand Mgt. Disability Mgt. Case Mgt Disability Mgt
Complex Case Management 1000 Lives 25% Disease/Demand Management 14,000 Lives 50% 15,000 Lives 15% Health Mgmt 70,000 Lives 10% Example Percentages of Integrated Health & Productivity Solution Example of 100,000 People in a Population % of Claims Cost % of Population 1% 14% 15% 70%
Prevention An investment to be leveraged… Rather than a cost to be justified.
1991 2003 Obesity Trends* Among U.S. Adults BRFSS, 1991, 1996, 2003 1996 (*BMI 30, or about 30 lbs overweight for 5’4” person) No Data <10% 10%–14% 15%–19% 20%–24% ≥25% Center for Disease Control and Prevention-- 2005 Data
Full Costs of Poor Health: Total Value of Health Medical & Pharmacy Presenteeism LTD STD Absenteeism Edington, Burton. A Practical Approach to Occupational and Environmental Medicine (McCunney). 140-152. 2003
Health Risk and Absenteeism Work Days Lost/Person/Year 12.6 Days 9.3 Days 6.4 Days 4+ Risks 3 Risks 1 Risks Tsai, et al. JOEM: Vol. 47, No. 8, August, 2005
Health Risk and Disability STD Days/Yr 13.16 Days 5.28 Days 2.45 Days 2-3 Risks 4+ Risks 0-1 Risks Source: Wayne Burton, MD, IHPM North American Summit Meeting 2000
Health Risk and Presenteeism % of Workplace Productivity Loss 26.9% 20.9% 14.7% 3-4 Risks 5+ Risks 0-2 Risks Source: Burton, et al, JOEM: Vol. 47. No. 8, August, 2005
Health Risks and Behaviors: X hours lost Source: Burton, Conti, Chen, Schultz, Edington. JOEM.41,863-877, 1999.
Disease States: X hours lost Source: Burton, Conti, Chen, Schultz, Edington. JOEM.41,863-877, 1999
Change in Costs follow Change in Risks Cost increased Cost reduced Risks Reduced Risks Increased Overall: Cost per risk reduced: $215; Cost per risk avoided: $304 Actives: Cost per risk reduced: $231; Cost per risk avoided: $320 Retirees<65: Cost per risk reduced: $192; Cost per risk avoided: $621 Retirees>65: Cost per risk reduced: $214; Cost per risk avoided: $264 Source: Updated from Edington, AJHP. 15(5):341-349, 2001.
Profitability Through Health-Related Productivity Enhancement
Employer Case Study Integrated Health & Productivity Enhancement
Who Is Incurring the Medical Costs? $12,001,184 Medical/Rx Costs Site % of Claims $ % of Population 24% 1% 40 Members $2,921,075 606 Members 15% 75% $ 9,131,472 1212 Members 30% 89% $ 10,767,963 4039 Mbrs 100% 100%
Top Medical Conditions by Total Medical/Pharmacy Costs Musculoskeletal Normal Delivery Pregnancy complications Fetal Immaturity Gynecological disorders Gallbladder disease Abdominal Pain Obesity Procedure complications Headaches (incl Migraine)
Corporate Wide vs SitePrevalence of Claims by Medical Condition Company Wide Boise Back Pain 2.8% 5.0% Headaches/ Migraines 2.0% 4.8% Diabetes 1.4% 2.8 Asthma 1.9% 2.6% Fetal Immaturity .07% 1.4%
Site 2002 1034 Average Length of Disability and Days per 100 Employees Site 2002 56.5 • ALOD = Average Days Absent - from date of disability to claim end date • Baseline = 1999 Full Year Results • Data has been annualized • STD closed claims only • 2002 ALOD is 14% higher than baseline • Days per 100 employees is 26% higher than baseline Claims Closed: 01/01/2001 to 09/30/2001 01/01/2002 to 09/30/2002 Company-wide vs. Boise Site Disability Experience
Medical and Disability Costs* Related to Medical Conditions • Includes direct disability costs, but does not include related absenteeism, presenteeism and productivity costs/losses *Disability Medical Dollars PEPY (per employee per year)
Aligning Incentives Increased Participation from 22% to 65% On-site Biometric Screening and Health Risk Assessment Incentives: • Initial = $15 Gift Certificate • $300 off next year’s annual health plan premiums To receive the ultimate incentives, the member: • If moderate or high risk, must participate in Lifestyle Management program • Engage in quality EBM initiatives with their physicians for better Care Management of current medical conditions • Or in Low Risk category
HRA Risk Stratification of DIRECTV Population Corporate vs. Boise
Health & Productivity Survey Results Corporate Wide
Health and Productivity HPQ Survey Survey Results • Data cross-matched with objective supervisor performance data from workplace • Results showed: • *HPQ presenteeism scale significantly predicts supervisor ratings of performance • About 10% of workforce has complex co-morbidity issues driving significant productivity losses due to presenteeism • Multiple conditions correlated to lower productivity Source: Kessler, Hymel, Loeppke, etal. JOEM. Vol 46 (6). June, 2004.
HRA related to Cost Trends Relative Increase in Medical/Pharmacy Costs in 2005 4X 2X 1X 0 HRAs 1 HRA 2 HRAs
Integrated Health & Productivity Enhancement In the Workplace Centers for Disease Control (CDC) Grant • Three year research study by CorSolutions and Cornell University to develop and implement new method of valuing an employer’s investment in the health of its workers • Determine whether DM and health risk reduction programs generate substantial ROI by reducing spending and absence, improving productivity • Job-specific presenteeism/absenteeism multipliers
Good Health is Good Business The Bottom Line