Download
1 / 17
220 likes | 1.05k Vues
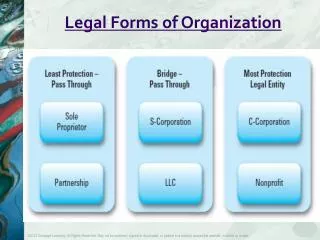
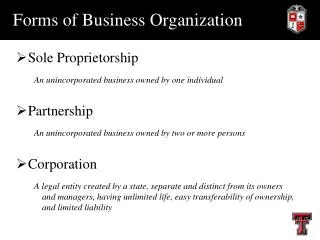
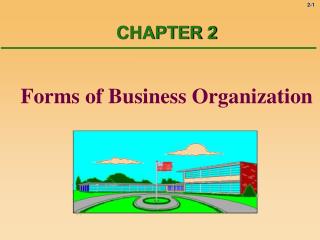
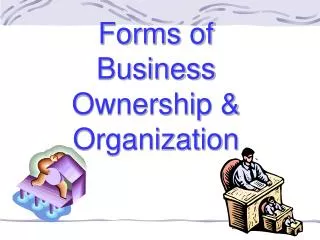
Forms of Business Organization. The Sole Proprietorship The Partnership General Partnership Limited Partnership The Corporation Advantages and Disadvantages Liquidity and Marketability of Ownership Control Liability Continuity of Existence Tax Considerations. Corporation. Partnership.

E N D
Forms of Business Organization • The Sole Proprietorship • The Partnership • General Partnership • Limited Partnership • The Corporation • Advantages and Disadvantages • Liquidity and Marketability of Ownership • Control • Liability • Continuity of Existence • Tax Considerations
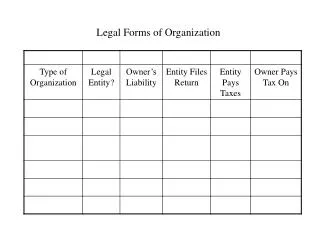
Corporation Partnership Liquidity Shares can easily be exchanged Subject to substantial restrictions. Voting Rights Usually each share gets one vote General Partner is in charge; limited partners may have some voting rights. Taxation Double with dividend tax credit Partnership income is taxable. Reinvestment Broad latitude All net cash flow is distributed to partners. Liability Limited liability General partners may have unlimited liability. Limited partners enjoy limited liability. Continuity Perpetual life Limited life A Comparison of Partnership and Corporations
Separation of Ownership and Control Board of Directors Management Debtholders Shareholders Debt Assets Equity
Sources of Information • Statistics Canada: • balance sheets, income statements, selected ratios • Dun and Bradstreet Canada: • key business ratios • The Financial Post and InfoGlobe: • financial databases • Internet • TSX (www.tsx.com) • OSC
The Balance Sheet • An accountant’s snapshot of the firm’s accounting value as of a particular date. • The Balance Sheet Identity is: • Assets ≡ Liabilities + Stockholder’s Equity
Balance Sheet Analysis • When analyzing a balance sheet, the financial manager should be aware of three concerns: • Liquidity • Debt versus equity • Value versus cost
Accounting Liquidity • Refers to the ease and speed with which assets can be converted to cash. • Current assets are the most liquid. • Some fixed assets are intangible. • The more liquid a firm’s assets, the less likely the firm is to experience problems meeting short-term obligations. • Liquid assets frequently have lower rates of return than fixed assets.
Value versus Cost • Under GAAP audited financial statements of firms in Canada carry assets at historical cost adjusted for depreciation. • Market value is a completely different concept. It is the price at which willing buyers and sellers trade the assets.
Financial ratios provide information about five areas of financial performance: • Short-term solvency • Activity • Financial leverage • Profitability • Market value
Short-term solvency ratios • Measure the firm’s ability to meet recurring financial obligations • A higher current ratio indicates greater liquidity
Activity ratios • Measure how effectively the firm’s assets are being managed • Example: retail and wholesale trade firms tend to have high asset turnover ratios compared to manufacturing firms
Activity ratios • Measure how quickly inventory is produced and sold.
Financial leverage ratios • Measure the extent to which a firm relies on debt financing .
Profitability ratios • trade firms and service firms tend to have low and high profit ratios respectively.
Market value ratios • P/E ratio shows how much investors are willing to pay for $1 of earnings per share. • It also reflects investors’ views of the growth potential of different sectors.
Market value ratios (continued) • The M/B ratio compares the market value of the firm’s investments to their cost . • a M/B value < 1 indicates that the firm has not been successful in creating value for its shareholders.
Remarks on ratios • Financial ratios are linked to one another. • Measures of profitability do not take risk or timing of cash flows into account.