
25%
10. 10. 10. 10. 10. 10. 10. 10. 20. 20. 20. 20. 20. 20. 20. 20. 100%. Collaboration. Expectations for Student Work. Student Support. Instructional Strategies. Assessment for Learning. Grading Practices. Curriculum Coherence. Coursetaking/Grouping. 0. 0. 0. 0. 0. 0. 0.

25%
E N D
Presentation Transcript
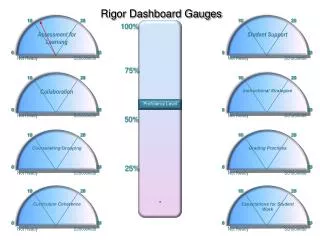
10 10 10 10 10 10 10 10 20 20 20 20 20 20 20 20 100% Collaboration Expectations for Student Work Student Support Instructional Strategies Assessment for Learning Grading Practices Curriculum Coherence Coursetaking/Grouping 0 0 0 0 0 0 0 0 30 30 30 30 30 30 30 30 Not Ready Not Ready Not Ready Not Ready Not Ready Not Ready Not Ready Not Ready Schoolwide Schoolwide Schoolwide Schoolwide Schoolwide Schoolwide Schoolwide Schoolwide 75% 50% 25% Rigor Dashboard Gauges Proficiency Level .
Scoring Example Assessment for Learning Not Ready Schoolwide 10 20 0 30 • 0 = No implementation • 10 = Getting Ready for Implementation • 20 = Emerging Implementation • 30 = Schoolwide Implementation Assessing Academic Rigor 2
Assessment for Learning Not Ready Schoolwide 10 20 0 30 3
10 10 10 10 10 10 10 10 10 10 20 20 20 20 20 20 20 20 20 20 Grading Practices Assessment for Learning Collaboration Curriculum Coherence Student Support Grading Practices Coursetaking/Grouping Curriculum Coherence Instructional Strategies Expectations for Student Work 0 0 0 0 0 0 0 0 0 0 30 30 30 30 30 30 30 30 30 30 Not Ready Not Ready Not Ready Not Ready Not Ready Not Ready Not Ready Not Ready Not Ready Not Ready Schoolwide Schoolwide Schoolwide Schoolwide Schoolwide Schoolwide Schoolwide Schoolwide Schoolwide Schoolwide Our Rigor Dashboard Gauges 0 = Not Ready 10 = Getting Ready for Implementation 20 = Emerging Implementation 30 = Schoolwide Implementation
10 10 10 10 10 20 20 20 20 20 Expectations for Student work Student Support Systems Assessment in the classroom Grading Practices Coursetaking/Grouping Collaboration Coursetaking/Grouping 0 0 0 0 0 30 30 30 30 30 Not Ready Not Ready Not Ready Not Ready Not Ready Not Ready Schoolwide Schoolwide School-wide School-wide School-wide School-wide NGMS Rigor Dashboard Gauges • Our definition of rigor: • Rigor is alignment : unit planning, Explaining Expectations and Making Assignments cognitively complex and at grade level, providing feedback, and working toward mastery for all students in order for students to be college ready • Our strategies to increase rigor school-wide: • Collaboration: • Student support Systems: • Grading Practices: • Assessment in the classroom • Expectations of student work • Where we are nowFebruary, 2012 and where we want to be by June, 2012 10 20 10 20 0 30 0 30 Assessing Academic Rigor 5 5
NGMS: Proficiency Gauge Proficiency Levels by grade levels and subject areas for 2011 fall NECAP data 100% 75% Grade 6-8 Reading – 67% Proficiency Level Grade 6-8 Writing– 50% 50% Proficiency Level Grade 6-8 Mathematics– 47% Proficiency Level 25% Assessing Academic Rigor 6
10 10 10 20 20 20 Coursetaking/Grouping Grading Practices Collaboration 0 0 0 30 30 30 Not Ready Not Ready Not Ready Schoolwide Schoolwide Schoolwide Example: Multiple Gauges 100% 75% Grade 10 ELA – 72% Proficiency Level Proficiency Level Grade 10 Math – 53% 50% Proficiency Level Algebra I EOCT – 42% Proficiency Level Amer History EOCT – 30% 25% Assessing Academic Rigor 7
10 10 10 20 20 20 100% Coursetaking/Grouping Collaboration Grading Practices 0 0 0 30 30 30 Not Ready Not Ready Not Ready Schoolwide Schoolwide Schoolwide 75% Proficiency Level Proficiency Level 50% Proficiency Level Proficiency Level 25% Example Dashboard • Our definition of rigor: • Rigor is . . . • Our strategies to increase rigor schoolwide: • Collaboration: We will . . . • Instructional Strategies: We will . . . • Grading Practices: We will . . . • Where we are now (date) and where we want to be by (date): Grade 6 Reading – 72% Grade 8 Reading – 53% Grade 6 Math – 42% Grade 8 Math – 30% Proficiency level data taken from 2006 administration of ISAP tests. New data for 2007 will be plotted October 1. Assessing Academic Rigor 8