District-Determined Measures
370 likes | 399 Vues
Learn about DDMs as a tool for fostering student growth and achievement, and how educators can collaborate to raise student learning levels. Key questions and examples provided.

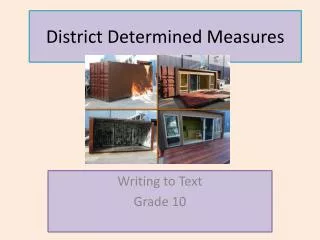
District-Determined Measures
E N D
Presentation Transcript
District-Determined Measures November 5, 2014 MASC/MASS Joint Conference
Two Separate Ratings Exemplary Proficient Needs Improvement Unsatisfactory High Moderate Low Summative Performance Rating Student Impact Rating
What is a DDM? • District-Determined • Measure of Student Growth • Aligned to Frameworks • Comparable Across District • District-Determined Measures are NOT measures of educator impact.
Student Impact Rating • Example: Middle School Music Teacher Year 1 Year 2
Major Shifts • From… • What teachersdo - - - > what studentsdo • Students’ proficiency- - - > students’ growth • Assessments within- - - > Assessments across
Identifying DDMs – Key Questions • Is the measure aligned to content? • Does it assess what the educators intend to teach and what’s most important for students to learn? • Is the measure informative? • Do the results tell educators whether students are making the desired progress, falling short, or excelling? • Do the results provide valuable information to schools and districts about their educators? See Technical Guide B for more about these key questions: http://www.doe.mass.edu/edeval/ddm/TechnicalGuideB.pdf
Meaningful Conversations • Does the DDM help different educators in the same role discuss issues of key content? • Does the DDM highlight areas of strengths between different educators?
State of the Commonwealth 265 72
In Practice… Lessons from Wakefield Dr. Stephen Zrike, Superintendent Dr. Kim Smith, Assistant Superintendent
DDMs as an opportunity… to foster student growth and achievement
An Opportunity for Wakefield Public Schools • Ongoing, just in time data collection, analysis and ACTION • Emphasis on growth • Educator influenced • Focus on student learning • Inclusive of all grade levels and content areas • Moving from data poor to data rich
Big Idea We can raise student achievement with the ongoing collaboration and collective inquiry of educators, expressly focused on student learning and growth, as measured by common assessments ------------------------------------------------------------ DDMs are common interim assessments designed for this purpose
Structures and Systems of Support • Mechanism for collaboration: Professional Learning Communities (PLCs) • Time: Consistent job-embedded collaboration • Professional Development: Investing in adult development • Coaching Model: Providing teams with continuous support in meeting objectives • Communication/Clarity: Communicate clear expectations and provide oversight to obtain desired outcomes
Professional Learning Community (PLC) structure • A culture of professional collaboration with student performance data as centerpiece of discussion • Educators develop strategic response to students’ needs in order to ensure high levels of learning for all students. DuFour, DuFour, & Eaker
Professional Development Provides opportunity for educators to: • understand PLC framework • learn how to work with data and practice specific data protocols • establish team norms and student learning goals
Consistent, Job-embedded Time • Budget-neutral redesign of school schedules at middle school and high school to facilitate grade level/content area educator teams to meet 1-3 times per 6-day cycle • Currently working on plan for implementing 1x5 in K-4 schools
Clear Expectations & Oversight • Provide a self-assessment rubric as a guide for teams to strive for exemplary performance • Principal is a regular presence at meetings providing guidance and support • Implement a reporting mechanism for teams to complete on a regular basis • District-wide steering committee
Launch Coaching Model Coaches (K-4), Coordinators (5-12), and Directors (K-12) bring knowledge of: • Common Core/MA State Standards • Best practices in data synthesis & analysis Have time to assist busy teachers with: • planning and details between meetings • accessing materials and resources to support their work
Key to success? Buy-in “State regulation says we have to do this” • will not inspire excitement, work ethic, and results from our teachers A goal that reads “8th grade students will improve MCAS ELA scores by 25% by May of 2015” • will not elicit passionate and tenacious effort from our teachers
Teacher-driven student learning goals • Allowing grade level/content area teacher teams to examine student performance data, discuss their hopes and dreams for their students, and target a specific area of student learning and growth that they believe is essential to achieving these hopes and dreams This is what will inspire sustained interest and resolute effort from teachers!
Provide “expert” support Principals, coaches, coordinators, & directors take the role of “expert” coaches • help PLC teams shape and refine their student learning goals and action plans • oversee and support PLC team work over the course of the year
District-wide Steering Committee • Establish a district-wide committee of educators (teachers and administrators) to share ideas, experiences, and feedback on a monthly basis • Process each new aspect of the Educator Evaluation system and provide recommendations for implementation • Include teacher union leadership to ensure voice and perspective in regard to the teachers’ contract
District-developed Educator Resource Manual Develop and provide educators with a district-developed resource • culling the vast amount of information and materials available at the state level to a manageable, user-friendly, and clear manual for local educators • providing a unique opportunity to “message” the Educator Evaluation system to match the values and context of the district
What are Parameters? • In the psychometric community the process is called “standard setting”. • Parameters support the critical conversation about what type of learning we expect, and what is above and below this expectation. • This is not a “last step” when creating an assessment.
Some Things Considered • Moderate growth is a range, not a point • Rigorous definition of low (all teachers will have some students who demonstrate low growth) • Focus on comparability across the scale. • Include a high enough “ceiling” so even high ability students can demonstrate growth
Some Approaches • Normative • Set Percentage of Students as High, Moderate, Low • Historical Normative • Based on historical or national percentages. • Qualitative • Professional judgment, using current assessment • Embedded • Predetermining parameters, and having scoring match
Example: All students growth scores are converted to z-scores and rank ordered. Scores one standard deviation below the mean are determined to be low growth, while scores one standard deviation above are determined to be high growth
Example: In Easthampton, Using Fountas and Pinnell’s data, a team of educators determine that roughly 50% of students grow between 4 and 6 levels. They determine that growth 3 or less levels is low growth, growing more than 6 levels is high growth.
Example: In Chelsea, A team of educators looked at the level of growth they would expect to see from students on the assessments that they built. If the pre-test score was 0-5, they expected 4 points of growth, a 6-9 fall score 2 points of growth, and for pre-test scores of 10-12 a perfect score. They then aggregated. They determined a high overall rating was 80% or more reaching targeted growth, while low was less than a third of students reaching target.
Example: Determining beforehand that no movement is low growth, one point is moderate growth, and two points is high growth. Then writing the rubric.
Resources: http://www.doe.mass.edu/edeval/ddm/ • Implementation Briefs • Technical Guide B • Webinar Series • Commissioner’s Memoranda • Educator Evaluation Newsletter • Technical Assistance and Networking Sessions • Using Current Assessments in DDMs (Curriculum Summit) • Example Assessments • Other ESE documents (Technical Guide A, Part VII, Regulations)
Questions • Ron Noble – rnoble@doe.mass.edu