Comprehensive Guide to Linear Programming and Sensitivity Analysis in Excel
This guide provides a thorough overview of Linear Programming (LP), including requirement definitions, objective functions, constraints, and feasible regions. We explore graphical solutions using the Corner Point and Iso-Profit Line methods, and detail how to utilize MS Excel for LP problems including formulation, Solver, and sensitivity analysis techniques. Key concepts like shadow prices, reductions in costs, and troubleshooting are covered. This resource is ideal for learners and practitioners looking to enhance their LP and Excel problem-solving skills.

Comprehensive Guide to Linear Programming and Sensitivity Analysis in Excel
E N D
Presentation Transcript
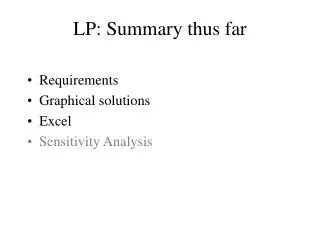
LP: Summary thus far • Requirements • Graphical solutions • Excel • Sensitivity Analysis
Requirements of a Linear Programming Problem • Objective Function: LP problems seek to maximize or minimize some quantity . • Constraints: restrictions that limit the degree to which we can pursue our objective. • Alternative courses of action. • Linearequations or inequalities.
Graphical Solutions for LP • Must be no more than 2 decision variables. • Plot the limits of the constraints. • Find the feasible region. • Determine the optimized solution (using corner point method or iso-profit line method).
Graphical Solutions for LP: Corner Point Method • Theory behind LP states that the optimal solution to any problem will lie at a cornerpoint, or extreme point of the feasible region. • Find result for each corner of the feasible region, pick the one that best satisfies the goal (within reason).
Graphical Solutions for LP: Iso-Profit Line Method • Find the slope of the optimization equation: • For a given profit level, there will be a (infinite) # combinations of X1 & X2, described as a line. • An iso-profit line that is farther from the origin (0,0) will have a greater profit level. • Find the intersection of the iso-profit slope with the farthestpoint of the feasible region.
Spreadsheet Solutions for LP: MS Excel • Formulate the optimization equation and the constraints. • Build spreadsheet with formulas showing the relationships between the various elements. • Using MS Excel Solver, define the cell to optimize, and the constraints on it.
Using MS Excel for LP: Answer Report • Binding & non-binding constraints • Slack
Using MS Excel for LP: Sensitivity Analysis • Reduced Cost: how much a coefficient would need to change to affect the optimal solution. (Ignore sign) • Allowable increase & decrease: how much a coefficient can change without changing the optimal combination for the solution (but it can change the actual optimized value)
Using MS Excel for LP: Sensitivity Analysis • Shadow Price: How much, per unit, the constraint affects the optimized value • Allowable increase & decrease: In what range does the shadow price hold true.
Using MS Excel for LP: Sensitivity Analysis • All data in the sensitivity analysis are based on changing ONE THING AT A TIME.
Using MS Excel for LP: Troubleshooting • Infeasibility: two possibilities: • An answer cannot be found that satisfies all constraints. • Part of the LP was input incorrectly. (More likely) • Unboundedness: • An answer has no limit to its goal. • Part of the LP was input incorrectly. (See above)
Using MS Excel for LP: Example • James Beerd and his cakes. GO TO
Using MS Excel for LP: Group Exercise • Fill in the formulas • Detail the constraints, etc. • GO TO SPREADSHEET
Using MS Excel for LP: Homework • pg. 55 #5: solve w/ MS Excel, discuss answer report & sensitivity report. • pg. 59 #14, part A: solve w/ MS Excel, discuss answer report & sensitivity analysis. Turn in printout of solved spreadsheet, and email or hand in on diskette the Excel files by BEGINNING OF CLASS Thursday, Sept. 10